
43 Prepare Financial Budgets
Patty Graybeal
Now that you have developed an understanding of operating budgets, let’s turn to the other primary component of the master budget: financial budgets. Preparing financial budgets involves examining the expectations for financing the operations of the business and planning for the cash needs of the organization. The budget helps estimate the source, amount, and timing of cash collection and cash payments as well as determine if and when additional financing is needed or debt can be paid.
Individual Financial Budgets
Preparing a financial budget first requires preparing the capital asset budget, the cash budgets, and the budgeted balance sheet. The capital asset budget represents a significant investment in cash, and the amount is carried to the cash budget. Therefore, it needs to be prepared before the cash budget. If the cash will not be available, the capital asset budget can be adjusted and, again, carried to the cash budget.
When the budgets are complete, the beginning and ending balance from the cash budget, changes in financing, and changes in equity are shown on the budgeted balance sheet.
Capital Asset Budget
The capital asset budget, also called the capital expenditure budget, shows the company’s plans to invest in long-term assets. Some assets, such as computers, must be replaced every few years, while other assets, such as manufacturing equipment, are purchased very infrequently. Some assets can be purchased with cash, whereas others may require a loan. Budgeting for these types of expenditures requires long-range planning because the purchases affect cash flows in current and future periods and affect the income statement due to depreciation and interest expenses.
Cash Budget
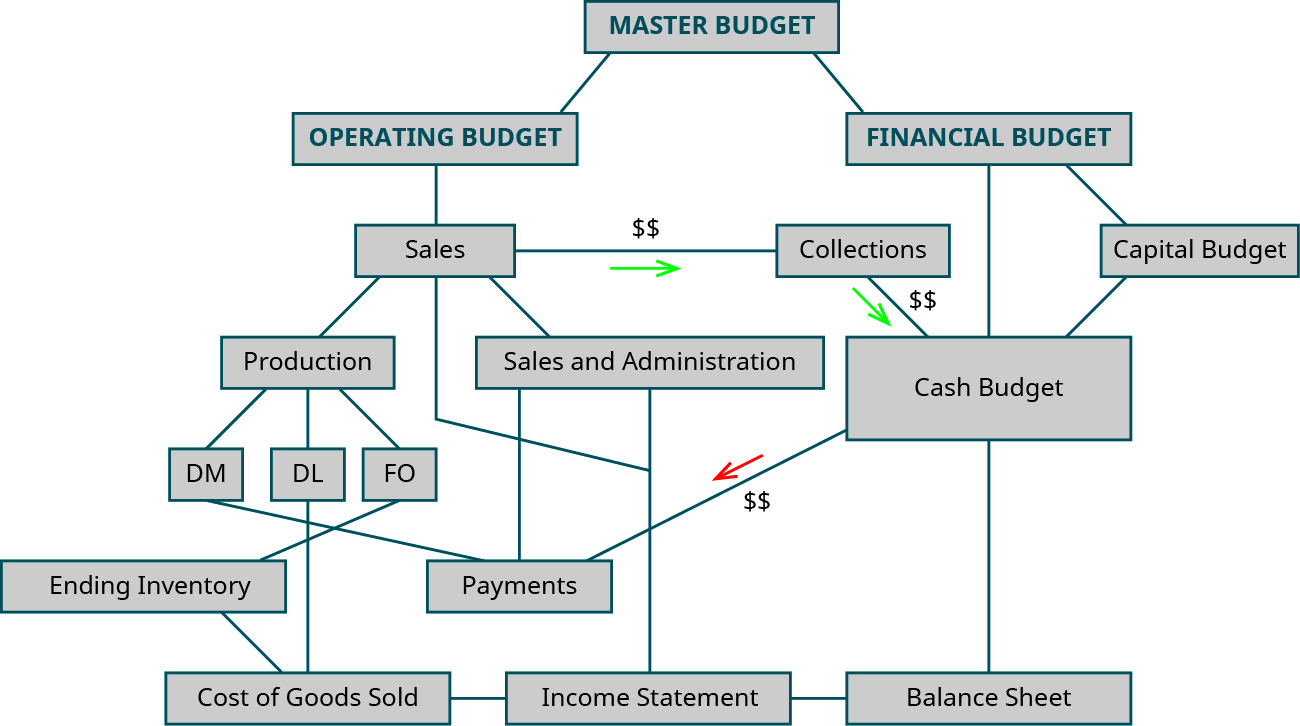
The cash budget is the combined budget of all inflows and outflows of cash. It should be divided into the shortest time period possible, so management can be quickly made aware of potential problems resulting from fluctuations in cash flow. One goal of this budget is to anticipate the timing of cash inflows and outflows, which allows a company to try to avoid a decrease in the cash balance due to paying out more cash than it receives. In order to provide timely feedback and alert management to short-term cash needs, the cash flow budget is commonly geared toward monthly or quarterly figures. (Figure) shows how the other budgets tie into the cash budget.
Cash is so important to the operations of a company that, often, companies will arrange to have an emergency cash source, such as a line of credit, to avoid defaulting on current payables due and also to protect against other unanticipated expenses, such as major repair costs on equipment. This line of credit would be similar in function to the overdraft protection offered on many checking accounts.
Because the cash budget accounts for every inflow and outflow of cash, it is broken down into smaller components. The cash collections schedule includes all of the cash inflow expected to be received from customer sales, whether those customers pay at the same rate or even if they pay at all. The cash collections schedule includes all the cash expected to be received and does not include the amount of the receivables estimated as uncollectible. The cash payments schedule plans the outflow or payments of all accounts payable, showing when cash will be used to pay for direct material purchases. Both the cash collections schedule and the cash payments schedule are included along with other cash transactions in a cash budget. The cash budget, then, combines the cash collection schedule, the cash payment schedule, and all other budgets that plan for the inflow or outflow of cash. When everything is combined into one budget, that budget shows if financing arrangements are needed to maintain balances or if excess cash is available to pay for additional liabilities or assets.
The operating budgets all begin with the sales budget. The cash collections schedule does as well. Since purchases are made at varying times during the period and cash is received from customers at varying rates, data are needed to estimate how much will be collected in the month of sale, the month after the sale, two months after the sale, and so forth. Bad debts also need to be estimated, since that is cash that will not be collected.
To illustrate, let’s return to Big Bad Bikes. They believe cash collections for the trainer sales will be similar to the collections from their bicycle sales, so they will use that pattern to budget cash collections for the trainers. In the quarter of sales, 65% of that quarter’s sales will be collected. In the quarter after the sale, 30% will be collected. This leaves 5% of the sales considered uncollectible. (Figure) illustrates when each quarter’s sales will be collected. An estimate of the net realizable balance of Accounts Receivable can be reconciled by using information from the cash collections schedule:
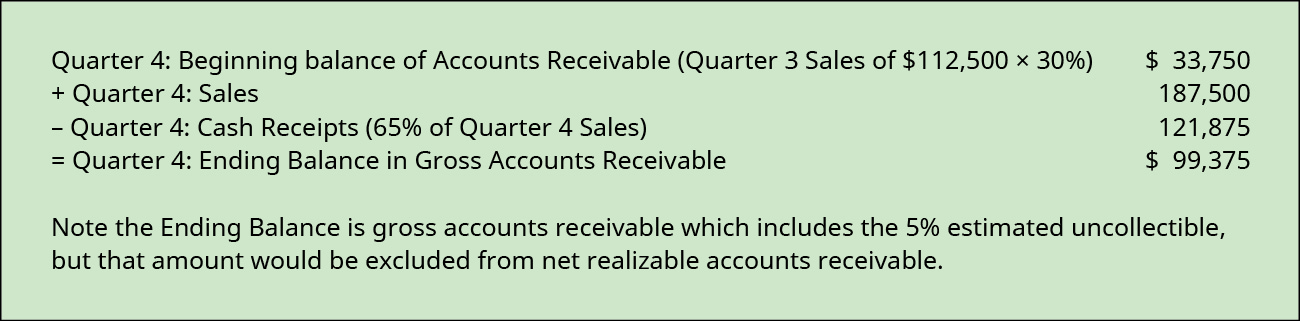
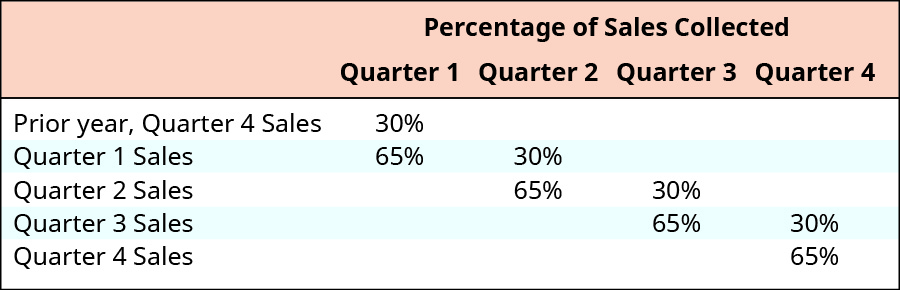
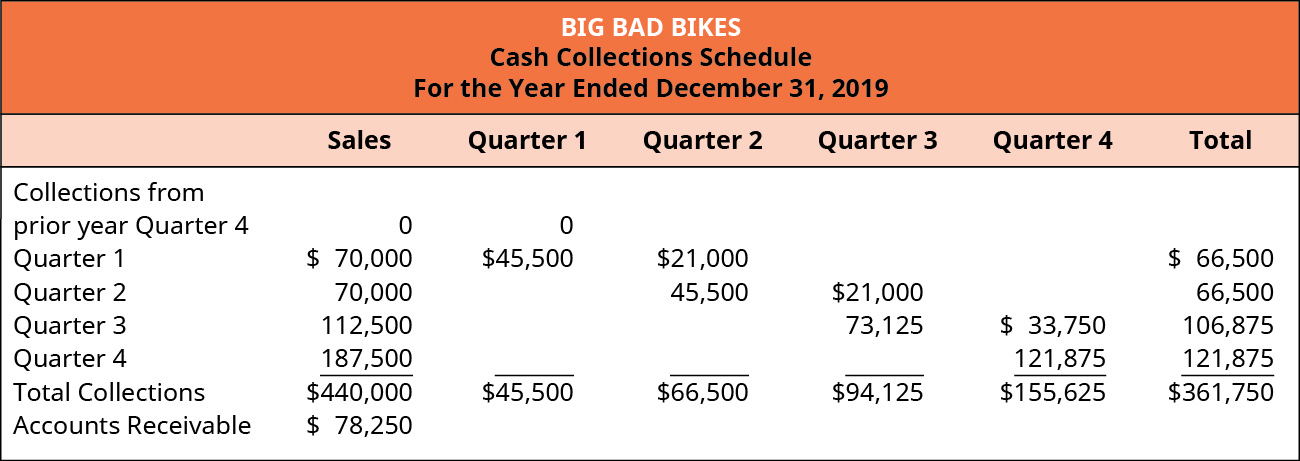
For example, in quarter 1 of year 2, 65% of the quarter 1 sales will be collected in cash, as well as 30% of the sales from quarter 4 of the prior year. There were no sales in quarter 4 of the prior year so 30% of zero sales shows the collections are $0. Using information from Big Bad Bikes sales budget, the cash collections from the sales are shown in (Figure).
When the cash collections schedule is made for sales, management must account for other potential cash collections such as cash received from the sale of equipment or the issuance of stock. These are listed individually in the cash inflows portion of the cash budget.
The cash payments schedule, on the other hand, shows when cash will be used to pay for Accounts Payable. One such example are direct material purchases, which originates from the direct materials budget. When the production budget is determined from the sales, management prepares the direct materials budget to determine when and how much material needs to be ordered. Orders for materials take place throughout the quarter, and payments for the purchases are made at different intervals from the orders. A schedule of cash payments is similar to the cash collections schedule, except that it accounts for the company’s purchases instead of the company’s sales. The information from the cash payments schedule feeds into the cash budget.
Big Bad Bikes typically pays half of its purchases in the quarter of purchase. The remaining half is paid in the following quarter, so payments in the first quarter include payments for purchases made during the first quarter as well as half of the purchases for the preceding quarter. (Figure) shows when each quarter’s purchases will be paid. Additionally, the balance of purchases in Accounts Payable can be reconciled by using information from the cash payment schedule as follows:
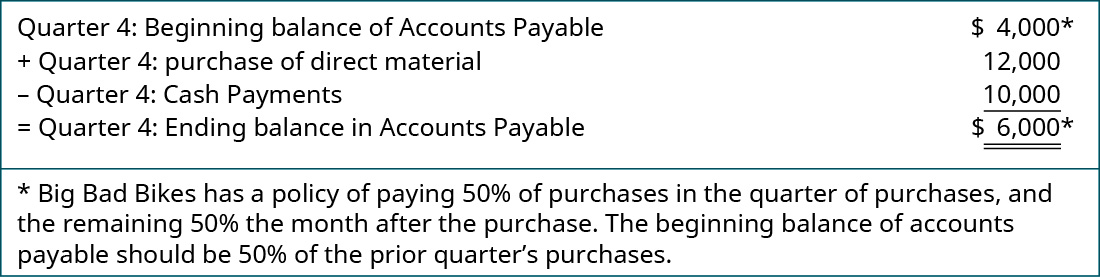
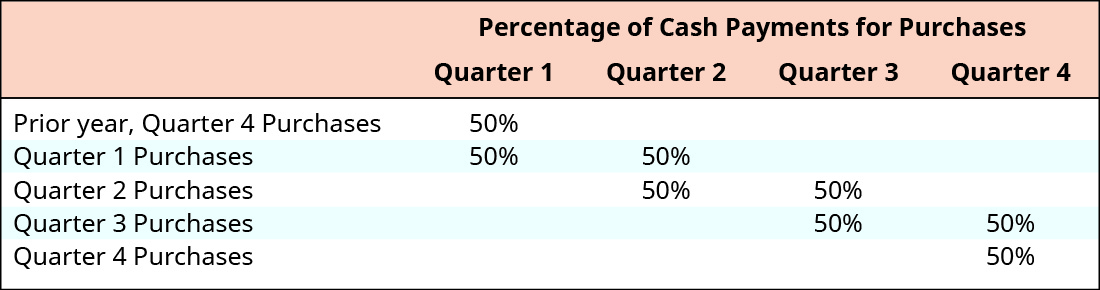
The first quarter of the year plans cash payments from the prior quarter as well as the current quarter. Again, since the trainers are a new product, in this example, there are no purchases in the preceding quarter, and the payments are $0. (Figure).
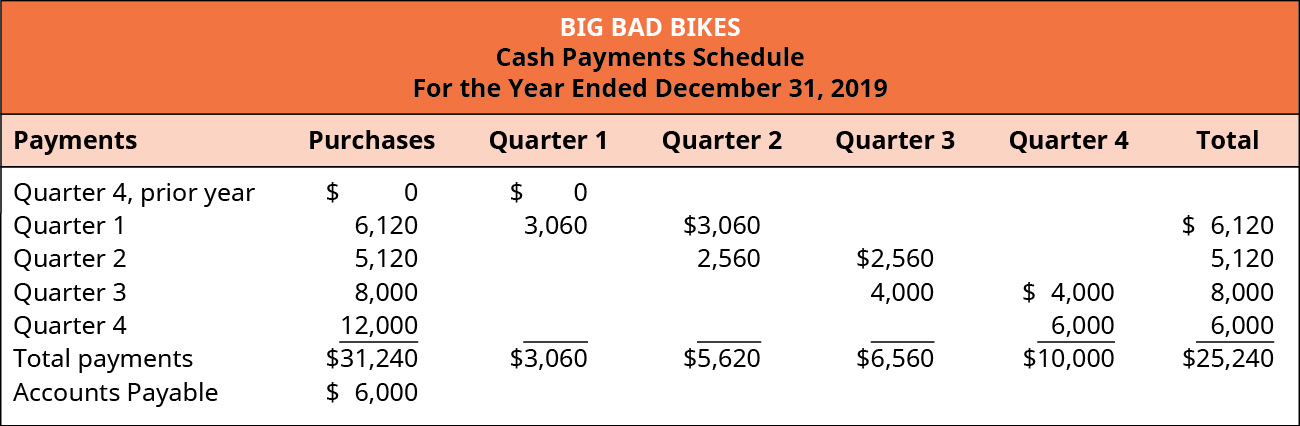
While the cash payments schedule is made for purchases of material on account, there are other outflows of cash for the company, and management must estimate all other cash payments for the year. Typically, this includes the manufacturing overhead budget, the sales and administrative budget, the capital asset budget, and any other potential payments of cash. Since depreciation is an expense not requiring cash, the cash budget includes the amount from the budgets less depreciation. Cash payments are listed on the cash budget following cash receipts. (Figure) shows the major components of the cash budget.
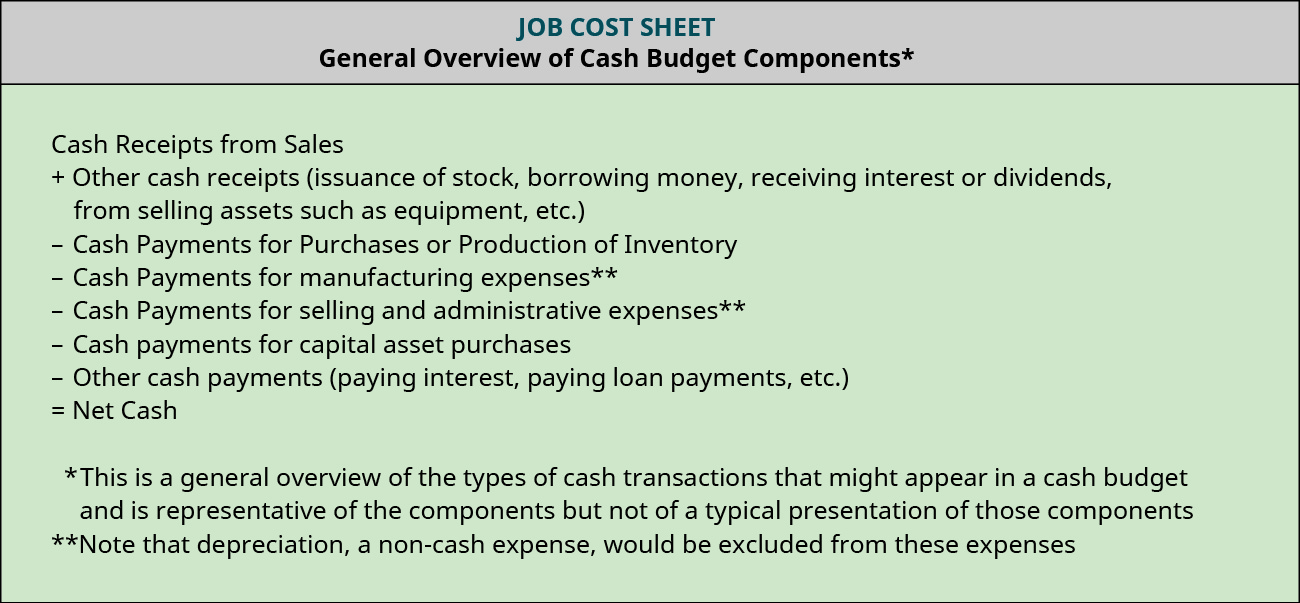
The cash budget totals the cash receipts and adds it to the beginning cash balance to determine the available cash. From the available cash, the cash payments are subtracted to compute the net cash excess or deficiency of cash for the quarter. This amount is the potential ending cash balance. Organizations typically require a minimum cash balance. If the potential ending cash balance does not meet the minimum amount, management must plan to acquire financing to reach that amount. If the potential ending cash balance exceeds the minimum cash balance, the excess amount may be used to pay any financing loans and interest.
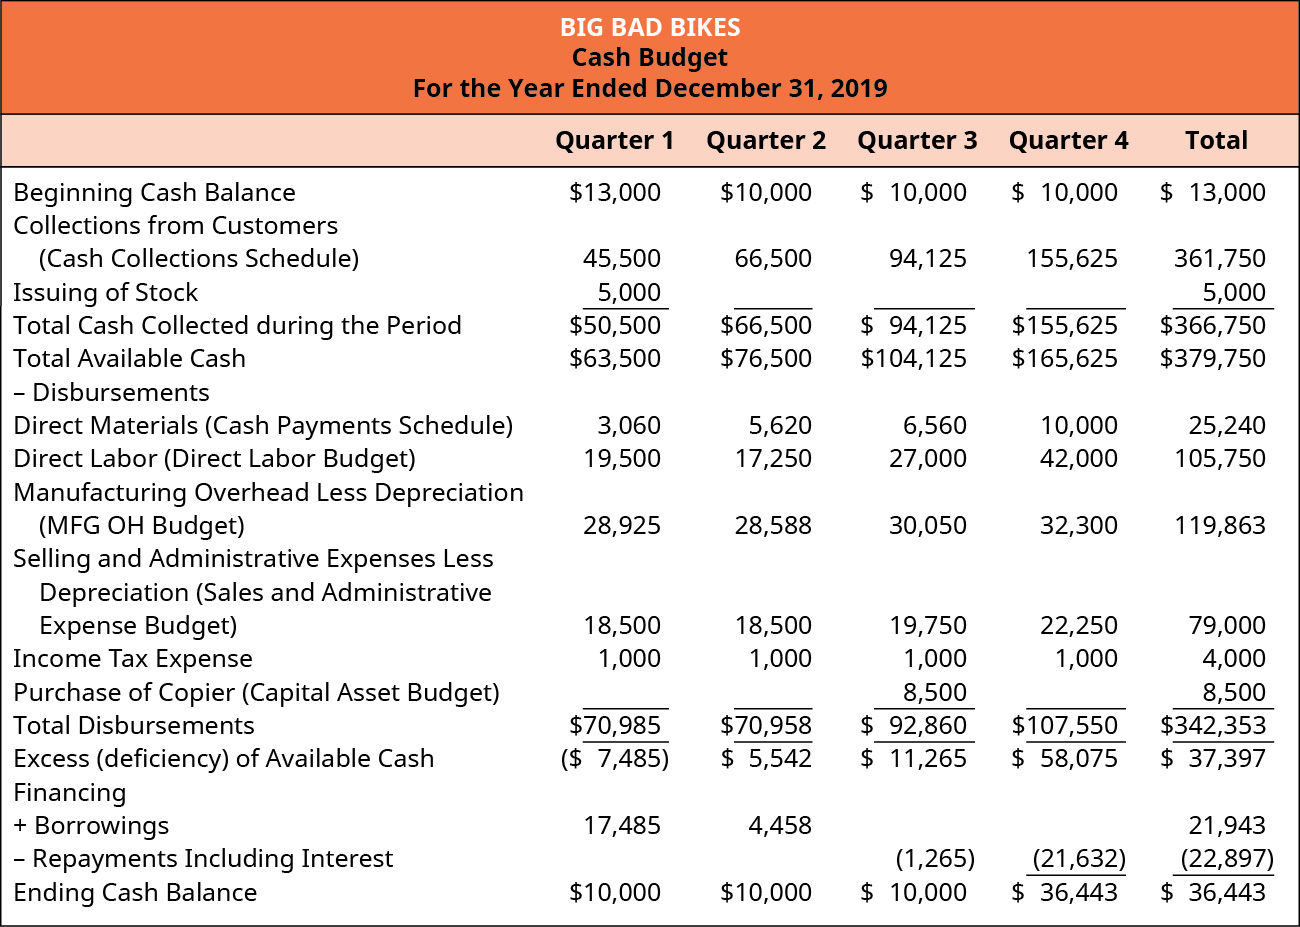
Big Bad Bikes has a minimum cash balance requirement of $10,000 and has a line of credit available for an interest rate of 19%. They also plan to issue additional capital stock for $5,000 in the first quarter, to pay taxes of $1,000 during each quarter, and to purchase a copier for $8,500 cash in the third quarter. The beginning cash balance for Big Bad Bikes is $13,000, which can be used to create the cash budget shown in (Figure).
Budgeted Balance Sheet
The cash budget shows how cash changes from the beginning of the year to the end of the year, and the ending cash balance is the amount shown on the budgeted balance sheet. The budgeted balance sheet is the estimated assets, liabilities, and equities that the company would have at the end of the year if their performance were to meet its expectations. (Figure) shows a list of the most common changes to the balance sheet and where the information is derived.
| Common Changes in the Budgeted Balance Sheet | |
|---|---|
| Information Source | Balance Sheet Change |
| Cash balance | ending cash balance from the cash budget |
| Accounts Receivable balance | uncollected receivables from the cash collections schedule |
| Inventory | ending balance in inventory as shown from calculations to create the income statement |
| Machinery & Equipment | ending balance in the capital asset budget |
| Accounts Payable | unpaid purchases from the cash payments schedule |
Other balance sheet changes throughout the year are reflected in the income statement and statement of cash flows. For example, the beginning cash balance of Accounts Receivable plus the sales, less the cash collected results in the ending balance of Accounts Receivable. A similar formula is used to compute the ending balance in Accounts Payable. Other budgets and information such as the capital asset budget, depreciation, and financing loans are used as well.
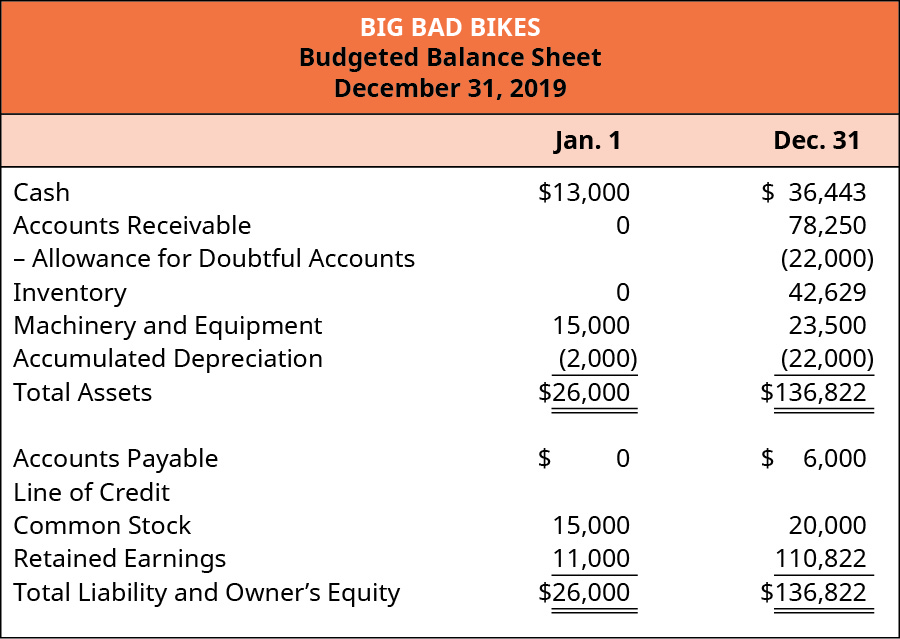
To explain how to use a budgeted balance sheet, let’s return to Big Bad Bikes. For simplicity, assume that they did not have accounts receivable or payable at the beginning of the year. They also incurred and paid back their financing during the year, so there is no ending debt. However, the cash budget shows cash inflows and outflows not related to sales or the purchase of materials. The company’s capital assets increased by $8,500 from the copier purchase, and their common stock increased by $5,000 from the additional issue as shown in (Figure).
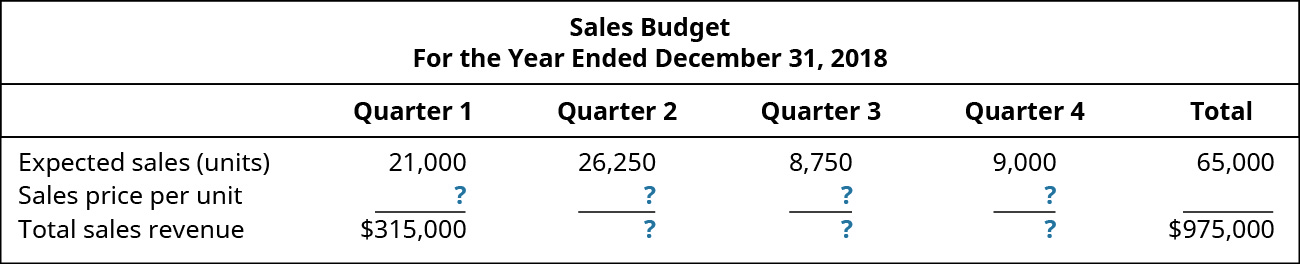
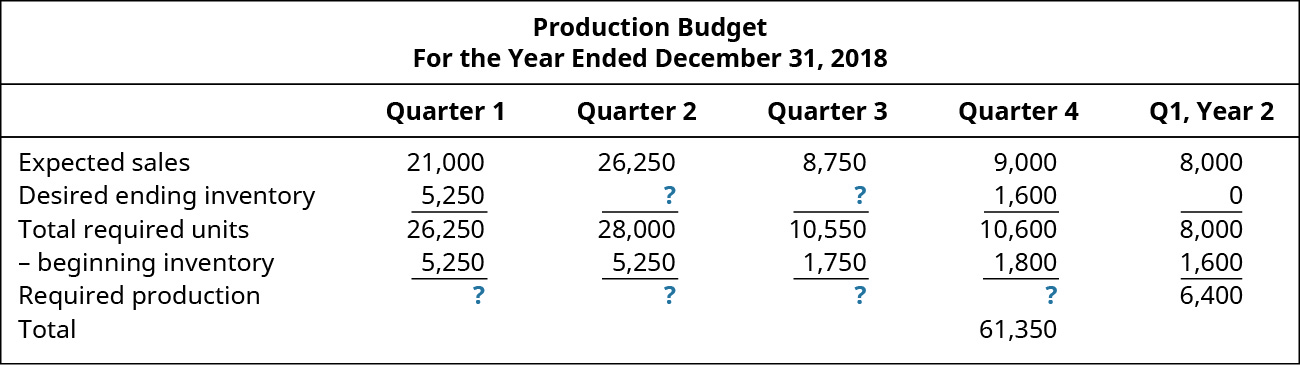
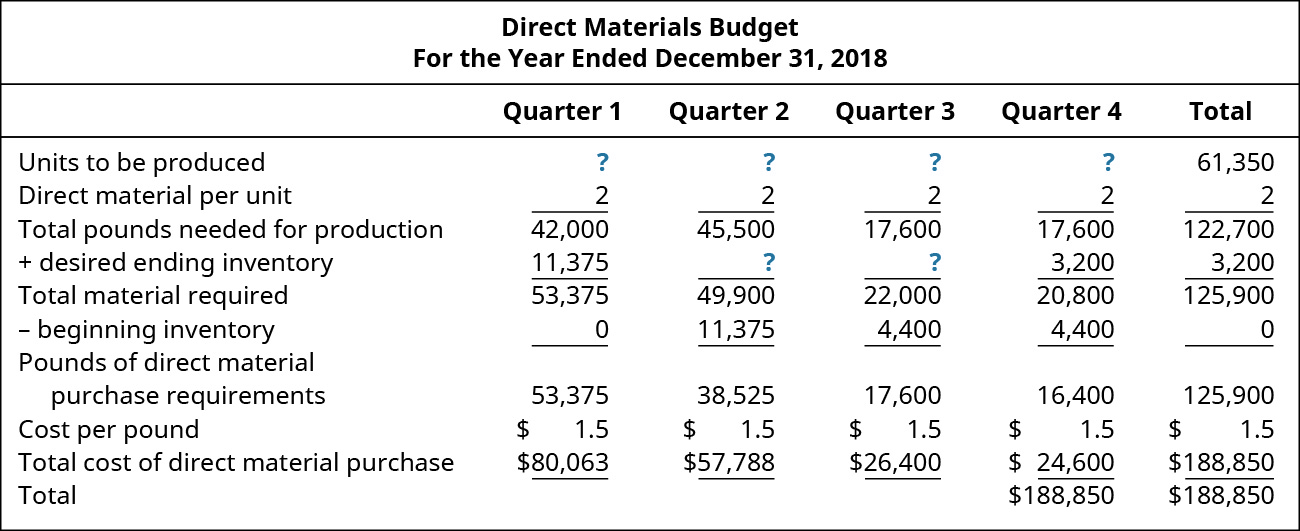
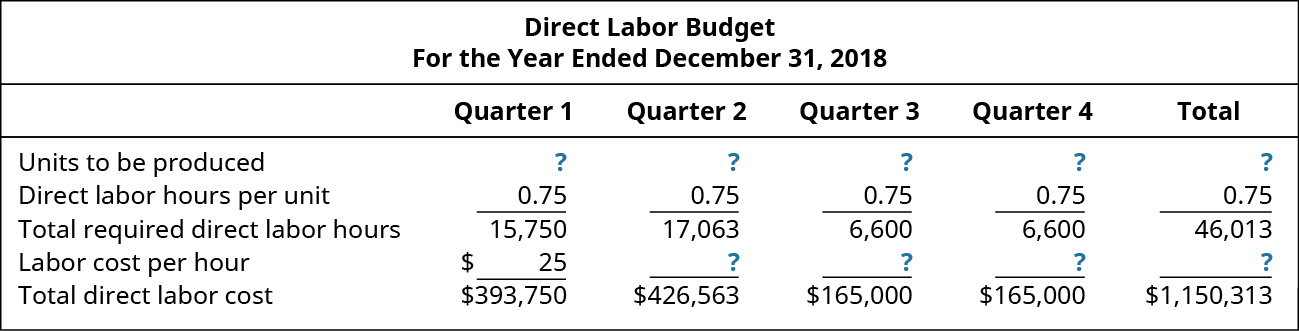
Though there seem to be many budgets, they all fit together like a puzzle to create an overall picture of how a company expects the upcoming business year to look. (Figure) detailed the components of the master budget, and can be used to summarize the budget process. All budgets begin with the sales budget. This budget estimates the number of units that need to be manufactured and precedes the production budget. The production budget (refer to (Figure)) provides the necessary information for the budgets needed to plan how many units will be produced. Knowing how many units need to be produced from the production budget, the direct materials budget, direct labor budget, and the manufacturing overhead budget are all prepared. The sales and administrative budget is a nonmanufacturing budget that relies on the sales estimates to pay commissions and other variable expenses. The sales and expenses estimated in all of these budgets are used to develop a budgeted income statement.
The estimated sales information is used to prepare the cash collections schedule, and the direct materials budget is used to prepare the cash payment schedule. The cash receipts and cash payments budget are combined with the direct labor budget, the manufacturing overhead budget, the sales and administrative budget, and the capital assets budget to develop the cash budget. Finally, all the information is used to flow to the budgeted balance sheet.
Molly Malone is starting her own company in which she will produce and sell Molly’s Macaroons. Molly is trying to learn about the budget process as she puts her business plan together. Help Molly by explaining the optimal order for preparing the following budgets and schedules and why this is the optimal order.
- budgeted balance sheet
- budgeted income statement
- capital asset budget
- cash budget
- cash collections schedule
- cash payments schedule
- direct materials budget
- direct labor budget
- master budget
- manufacturing overhead
- production budget
- sales budget
- selling and administrative budget
Solution
A master budget always begins with the sales budget must be prepared first as this determines the number of units that will need to be produced. The next step would be to create the production budget, which helps determine the number of units that will need to be produced each period to meet sales goals. Once Molly knows how many units she will need to produce, she will need to budget the costs associated with those units, which will require her to create the direct materials budget, the direct labor budget and the manufacturing overhead budget. But Molly will have costs other than manufacturing costs so she will need to create a selling and administrative expenses budget. Molly will need to determine what are her capital asset needs and budget for those. Now that Molly has all her revenues budgeted and her costs budgeted, she can determine her budgeted cash inflows and outflows by putting together the cash schedules that lead to the cash budget. Molly will then need to create a cash collections schedule and a cash payments schedule and that information, along with the cash inflow and outflow information from her other budgets, will allow her to create her cash budget. Once Molly has completed her cash budget she will be able to put together her budgeted income statement and budgeted balance sheet.
Key Concepts and Summary
- The financial budgets include the capital asset budget and the cash budget. The cash collections schedule and cash payments schedule are computed and combined with the other budgets to develop the cash budget.
- Information from the other budgets and the budgeted income statement are used to develop the budgeted balance sheet.
(Figure)The cash budget is part of which category of budgets?
- sales budget
- cash payments budget
- finance budget
- operating budget
C
(Figure)Which is not a section of the cash budget?
- cash receipts
- cash disbursements
- allowance for uncollectible accounts
- financing needs
(Figure)Which budget is the starting point in preparing financial budgets?
- the budgeted income statement
- the budgeted balance sheet
- the capital expense budget
- the cash receipts budget
A
(Figure)Which of the following includes only financial budgets?
- capital asset budget, budgeted income statement, sales budget
- production budget, capital asset budget, budgeted balance sheet
- cash budget, budgeted balance sheet, capital asset budget
- budgeted income statement, direct material purchases budget, cash budget
(Figure)What is the process for developing a budgeted balance sheet?
The budgeted income statement includes the estimated revenue and expenses for the company. Using historical data on cash collections helps plan when the cash will be received and is used to develop the cash collections schedule. The company applies its payment policies on its purchases and other items requiring cash expenditures. This creates the cash payments schedule. Information from the cash collections schedule, cash payments schedule, and the capital expense budget are combined to develop the cash budget. The information from the cash budget and the ending balance sheet from the preceding year are used to develop the budgeted balance sheet.
(Figure)Which of the financial budgets is the most important? Why?
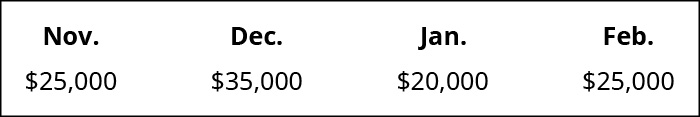
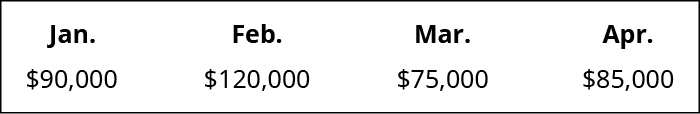
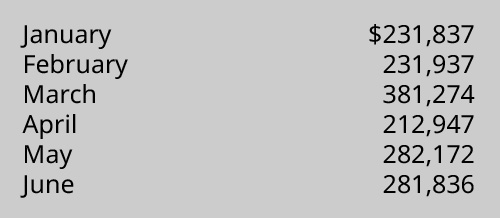
(Figure)Cash collections for Wax On Candles found that 60% of sales were collected in the month of the sale, 30% was collected the month after the sale, and 10% was collected the second month after the sale. Given the sales shown, how much cash will be collected in January and February?
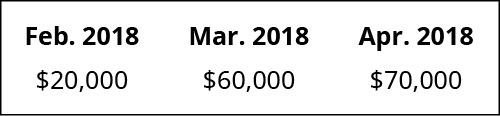
(Figure)Nonna’s Re-Appliance Store collects 55% of its accounts receivable in the month of sale and 40% in the month after the sale. Given the following sales, how much cash will be collected in February?
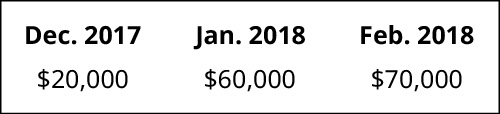
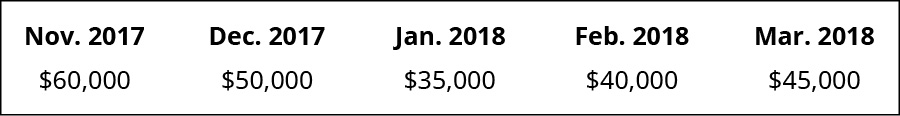
(Figure)Dream Big Pillow Co. pays 65% of its purchases in the month of purchase, 30% the month after the purchase, and 5% in the second month following the purchase. It made the following purchases at the end of 2017 and the beginning of 2018:
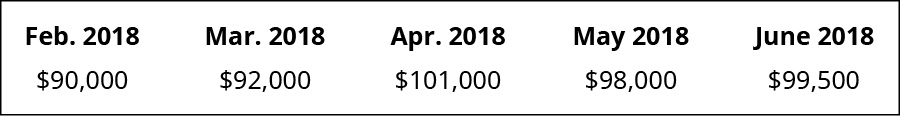
(Figure)Desiccate purchases direct materials each month. Its payment history shows that 70% is paid in the month of purchase with the remaining balance paid the month after purchase. Prepare a cash payment schedule for March if in January through March, it purchased $35,000, $37,000, and $39,000, respectively.
(Figure)What is the amount of budgeted cash payments if purchases are budgeted for $420,000 and the beginning and ending balances of accounts payable are $95,000 and $92,000, respectively?
(Figure)Halifax Shoes has 30% of its sales in cash and the remainder on credit. Of the credit sales, 65% is collected in the month of sale, 25% is collected the month after the sale, and 5% is collected the second month after the sale. How much cash will be collected in August if sales are estimated as $75,000 in June, $65,000 in July, and $90,000 in August?
(Figure)Cash collections for Renew Lights found that 65% of sales were collected in the month of sale, 25% was collected the month after the sale, and 10% was collected the second month after the sale. Given the sales shown, how much cash will be collected in March and April?
(Figure)My Aunt’s Closet Store collects 60% of its accounts receivable in the month of sale and 35% in the month after the sale. Given the following sales, how much cash will be collected in March?
(Figure)Gear Up Co. pays 65% of its purchases in the month of purchase, 30% in the month after the purchase, and 5% in the second month following the purchase. What are the cash payments if it made the following purchases in 2018?
(Figure)Drainee purchases direct materials each month. Its payment history shows that 65% is paid in the month of purchase with the remaining balance paid the month after purchase. Prepare a cash payment schedule for January using this data: in December through February, it purchased $22,000, $25,000, and $23,000 respectively.
(Figure)What is the amount of budgeted cash payments if purchases are budgeted for $190,500 and the beginning and ending balances of accounts payable are $21,000 and $25,000, respectively?
(Figure)Earthie’s Shoes has 55% of its sales in cash and the remainder on credit. Of the credit sales, 70% is collected in the month of sale, 15% is collected the month after the sale, and 10% is collected the second month after the sale. How much cash will be collected in June if sales are estimated as $75,000 in April, $65,000 in May, and $90,000 in June?
(Figure)Relevant data from the Poster Company’s operating budgets are:
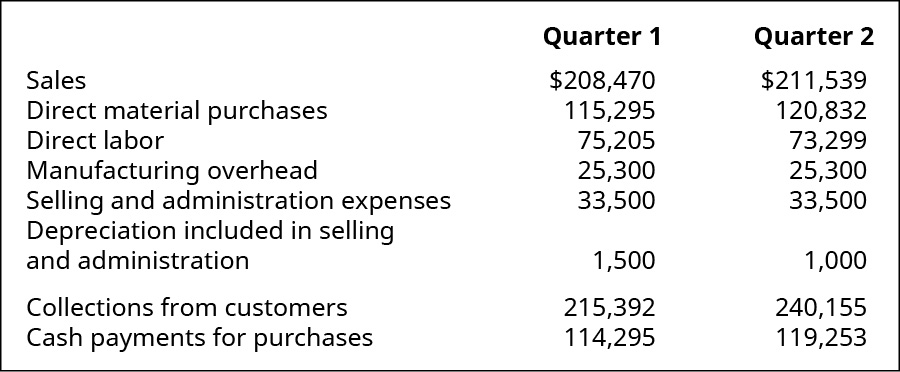
Additional data: Capital assets were sold in January for $10,000 and $4,500 in May. Dividends of $4,500 were paid in February. The beginning cash balance was $60,359 and a required minimum cash balance is $59,000. Use this information to prepare a cash budget for the first two quarters of the year
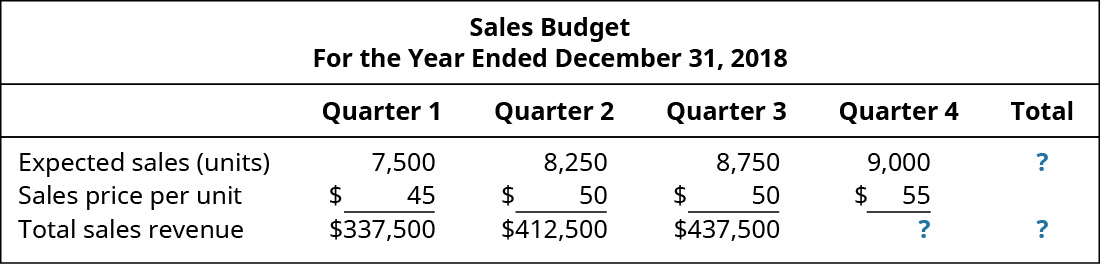
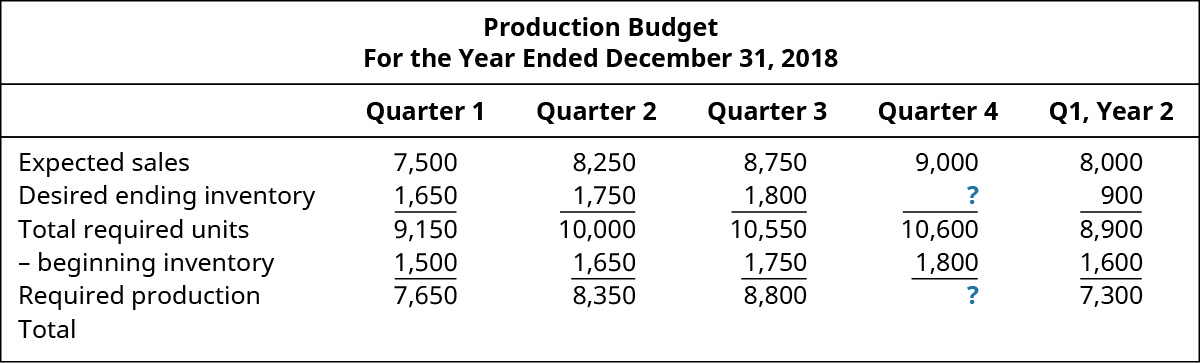
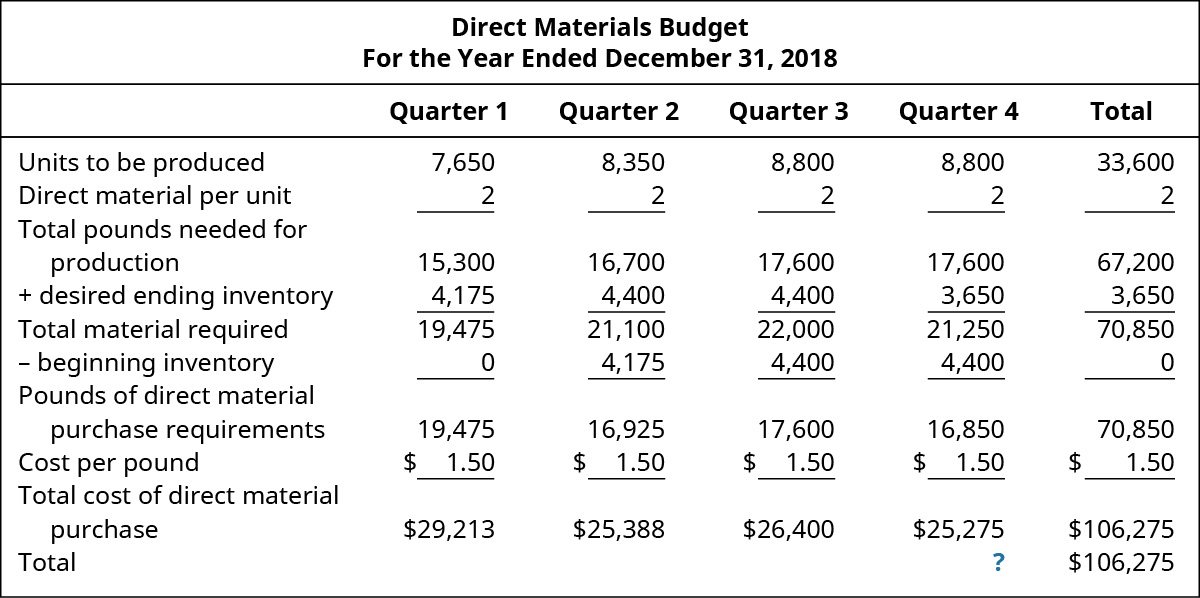
(Figure)Fill in the missing information from the following schedules:
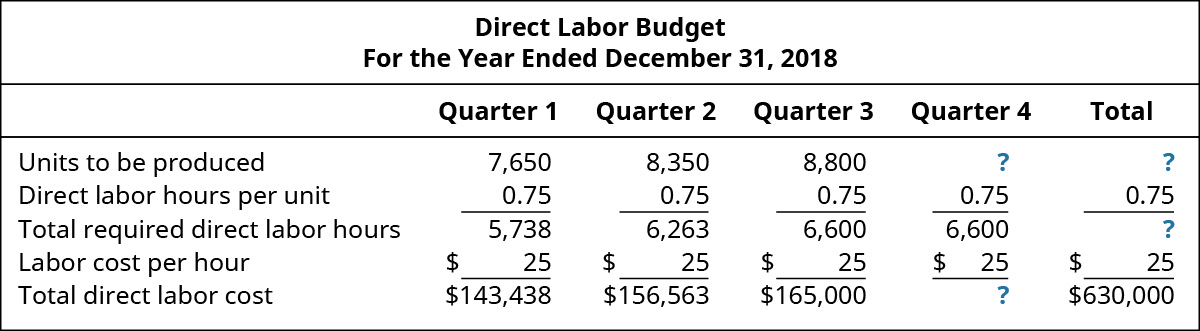
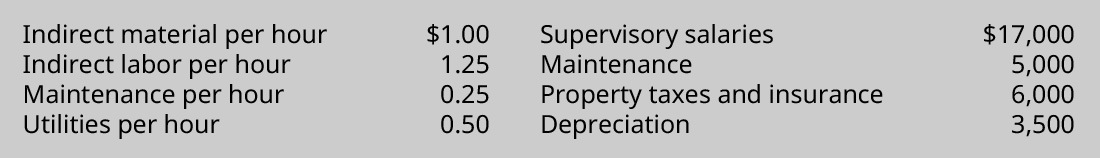
(Figure)Direct labor hours are estimated as 2,000 in Quarter 1; 2,100 in Quarter 2; 1,900 in Quarter 3; and 2,300 in Quarter 4. Prepare a manufacturing overhead budget using the information provided.
(Figure)Fitbands’ estimated sales are:
What are the balances in accounts receivable for January, February, and March if 65% of sales is collected in the month of sale, 25% is collected the month after the sale, and 10% is second month after the sale?
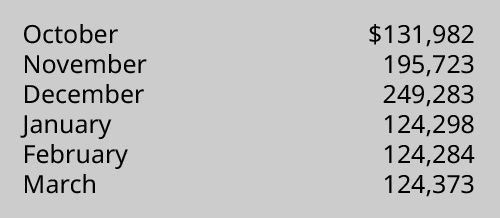
(Figure)Sports Socks has a policy of always paying within the discount period and each of its suppliers provides a discount of 2% if paid within 10 days of purchase. Because of the purchase policy, 85% of its payments are made in the month of purchase and 15% are made the following month. The direct materials budget provides for purchases of $129,582 in November, $294,872 in December, $239,582 in January, and $234,837 in February. What is the balance in accounts payable for January 31, and February 28?
(Figure)Relevant data from the operating budget of The Framers are:
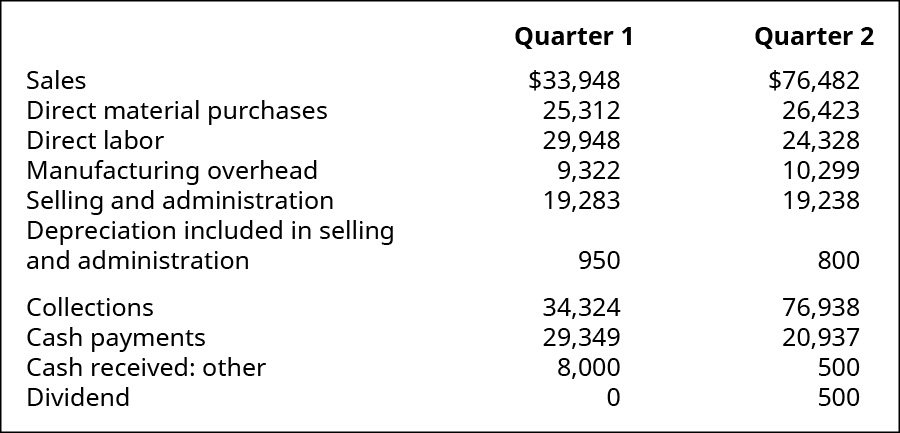
Other data:
- Capital assets were sold in quarter 1 and $8,000 was collected in quarter 1 and $500 collected in quarter 2.
- Dividends of $500 will be paid in May
- The beginning cash balance was $50,000 and a required minimum cash balance is $10,000.
- Prepare a cash budget for the first two quarters of the year.
(Figure)Fill in the missing information from the following schedules:
(Figure)Mesa Aquatics, Inc. estimated direct labor hours as 1,900 in quarter 1, 2,000 in quarter 2, 2,200 in quarter 3, and 1,800 in quarter 4. a sales and administration budget using the information provided.

(Figure)Amusement tickets estimated sales are:
What are the balances in accounts receivable for April, May, and June if 60% of sales are collected in the month of sale, 30% are collected the month after the sale, and 10% are collected the second month after the sale?
(Figure)All Temps has a policy of always paying within the discount period, and each of its suppliers provides a discount of 2% if paid within 10 days of purchase. Because of the purchase policy, 80% of its payments are made in the month of purchase and 20% are made the following month. The direct materials budget provides for purchases of $23,812 in February, $23,127 in March, $21,836 in April, and $28,173 in May. What is the balance in accounts payable for April 30, and May 31?
Glossary
- budgeted balance sheet
- estimated assets, liabilities, and equities that the company would have at the end of the year if their performance were to meet its expectations
- capital asset budget
- budget showing the organization’s plans to invest in long-term assets
- cash budget
- combined budget of all cash inflows and outflows of the organization
- cash collections schedule
- schedule showing when cash will be received from customers
- cash payments schedule
- schedule showing when cash will be used to pay for direct material purchases
