
17 Perform Break-Even Sensitivity Analysis for a Multi-Product Environment Under Changing Business Situations
Patty Graybeal
Up to this point in our CVP analysis, we have assumed that a company only sells one product, but we know that, realistically, this is not the case. Most companies operate in a multi-product environment, in which they sell different products, manufacture different products, or offer different types of services. Companies price each one of their products or services differently, and the costs associated with each of those products or services vary as well. In addition, companies have limited resources, such as time and labor, and must decide which products to sell or produce and in what quantities, or which services to offer in order to be the most profitable. These profitability considerations are often what contributes substance to a sales mix decision
The Basics of Break-Even Analysis in a Multi-Product Environment
In order to perform a break-even analysis for a company that sells multiple products or provides multiple services, it is important to understand the concept of a sales mix. A sales mix represents the relative proportions of the products that a company sells—in other words, the percentage of the company’s total revenue that comes from product A, product B, product C, and so forth. Sales mix is important to business owners and managers because they seek to have a mix that maximizes profit, since not all products have the same profit margin. Companies can maximize their profits if they are able to achieve a sales mix that is heavy with high-margin products, goods, or services. If a company focuses on a sales mix heavy with low-margin items, overall company profitability will often suffer.
Performing a break-even analysis for these multi-product businesses is more complex because each product has a different selling price, a different variable cost, and, ultimately, a different contribution margin. We must also proceed under the assumption that the sales mix remains constant; if it does change, the CVP analysis must be revised to reflect the change in sales mix. For the sake of clarity, we will also assume that all costs are companywide costs, and each product contributes toward covering these companywide costs.
You are the manager of a sub shop located near a college campus. The college has recently added a fast-food style café to the student center, which has reduced the number of students eating at your restaurant. Your highest margin items are drinks (a contribution margin of approximately 90%) and vegetarian subs (a contribution margin of approximately 75%). How can you use CVP analysis to help you compete with the college’s café? What would you suggest as possible ways to increase business while maintaining target income levels?
Calculating Break-Even Analysis in a Multi-Product Environment
When a company sells more than one product or provides more than one service, break-even analysis is more complex because not all of the products sell for the same price or have the same costs associated with them: Each product has its own margin. Consequently, the break-even point in a multi-product environment depends on the mix of products sold. Further, when the mix of products changes, so does the break-even point. If demand shifts and customers purchase more low-margin products, then the break-even point rises. Conversely, if customers purchase more high-margin products, the break-even point falls. In fact, even if total sales dollars remain unchanged, the break-even point can change based on the sales mix. Let’s look at an example of how break-even analysis works in a multi-product environment.
In multi-product CVP analysis, the company’s sales mix is viewed as a composite unit, a selection of discrete products associated together in proportion to the sales mix. The composite unit is not sold to customers but is a concept used to calculate a combined contribution margin, which is then used to estimate the break-even point. Think of a composite unit as a virtual basket of fruit that contains the proportion of individual fruits equal to the company’s sales mix. If we purchased these items individually to make the fruit basket, each one would have a separate price and a different contribution margin. This is how a composite unit works in CVP analysis. We calculate the contribution margins of all of the component parts of the composite unit and then use the total to calculate the break-even point. It is important to note that fixed costs are allocated among the various components (products) that make up this composite unit. Should a product be eliminated from the composite unit or sales mix, the fixed costs must be re-allocated among the remaining products.
If we use the fruit basket as an example, we can look at the individual fruits that make up the basket: apples, oranges, bananas, and pears. We see that each individual fruit has a selling price and a cost. Each fruit has its own contribution margin. But how would we determine the contribution margin for a composite of fruit, or in other words, for our basket of fruit?
For our particular baskets, we will use 5 apples, 3 oranges, 2 bananas, and 1 pear. This means that our product mix is 5:3:2:1, as shown in (Figure).
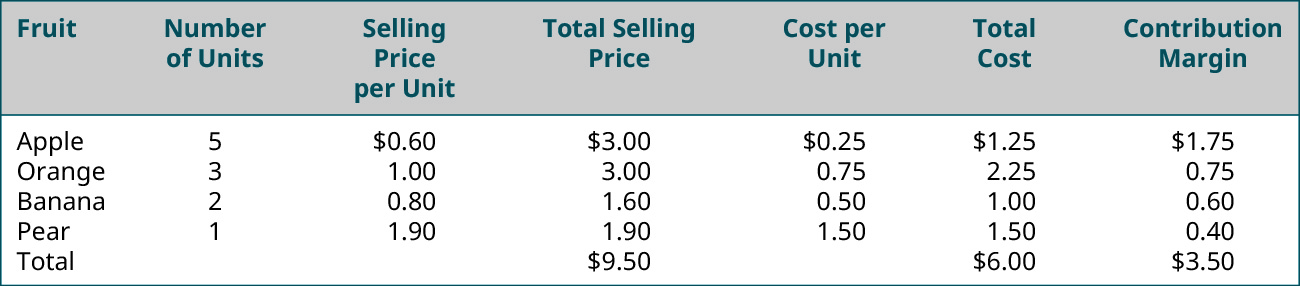
Notice that the composite contribution margin is based on the number of units of each item that is included in the composite item. If we change the composition of the basket, then the composite contribution margin would change even though contribution margin of the individual items would not change. For example, if we only include 4 apples, the contribution margin of a single apple is still ?0.35, but the contribution margin of the apples in the basket is ?1.40, not ?1.75 as it is when 5 apples are included in the basket. Let’s look at an additional example and see how we find the break-even point for a composite good.
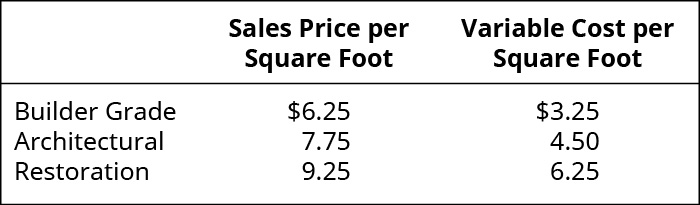
We will consider West Brothers for an example of a multi-product break-even analysis. West Brothers manufactures and sells 3 types of house siding: restoration vinyl, architectural vinyl, and builder grade vinyl, each with its own sales price, variable cost, and contribution margin, as shown:
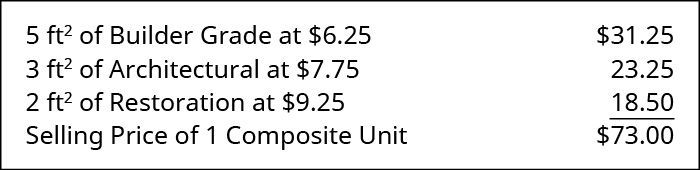
The sales mix for West Brothers is 5 ft2 of builder grade to 3 ft2 of architectural grade to 2 ft2 of restoration grade vinyl (a ratio of 5:3:2). This sales mix represents one composite unit, and the selling price of one composite unit is:
West Brothers’ fixed costs are ?145,000 per year, and the variable costs for one composite unit are:
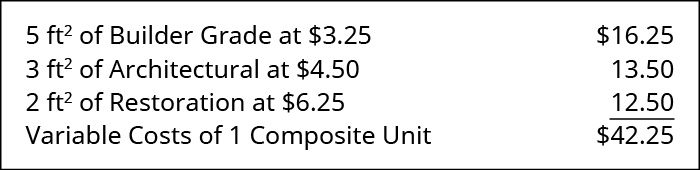
We will calculate the contribution margin of a composite unit for West Brothers using the same formula as before:

Applying the formula, we determine that ?73 – ?42.25 = 30.75. We then use the contribution margin per composite unit to determine West Brothers’ break-even point:
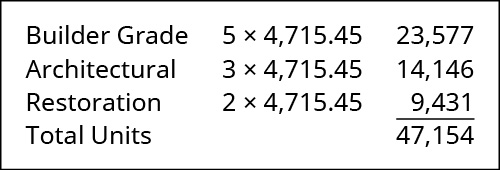
West Brothers will break even when it sells 4,715.45 (or 4,716 since it can’t sell a partial unit) composite units. To determine how many of each product West Brothers needs to sell, we apply their sales mix ratio (5:3:2) to the break-even quantity as follows:
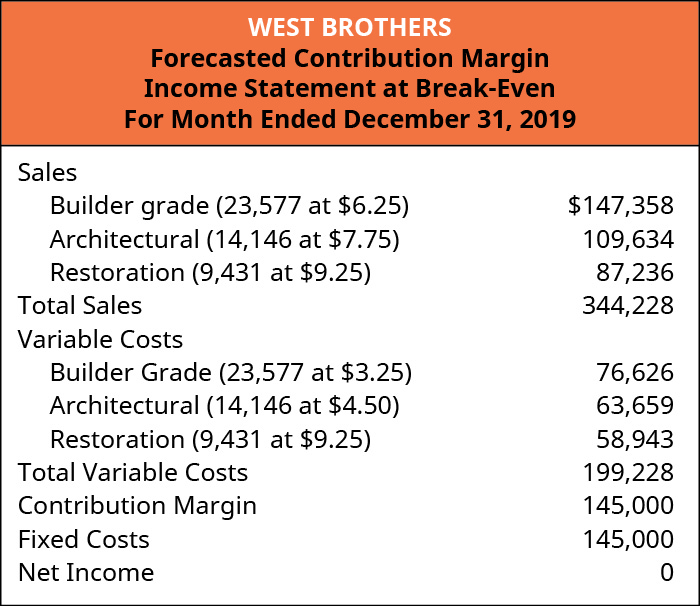
Using a forecasted or estimated contribution margin income statement, we can verify that the quantities listed will place West Brothers at break-even.
West Brothers can use this CVP analysis for a wide range of business decisions and for planning purposes. Remember, however, that if the sales mix changes from its current ratio, then the break-even point will change. For planning purposes, West Brothers can change the sales mix, sales price, or variable cost of one or more of the products in the composite unit and perform a “what-if” analysis.
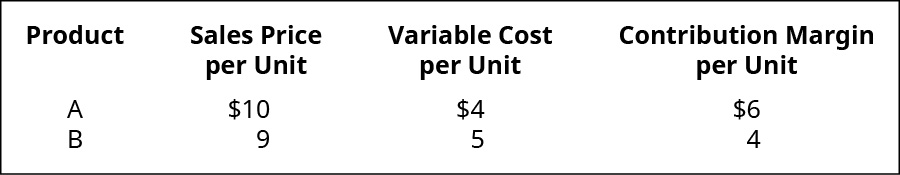
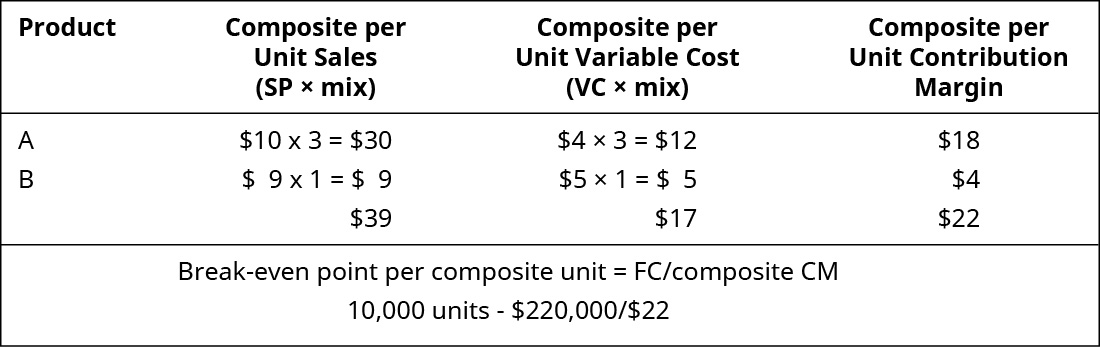
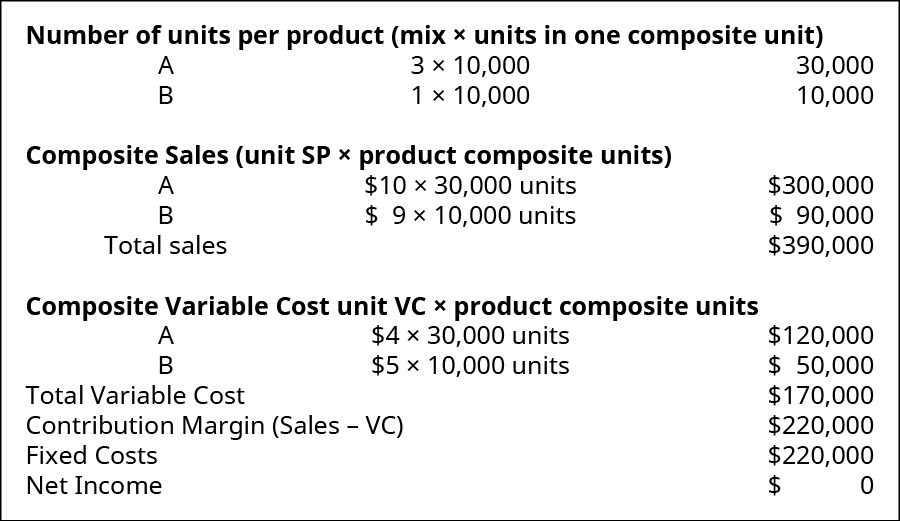
The sales mix of a company selling two products, A and B, is 3:1. The per-unit variable costs is ?4 for Product A and ?5 for Product B. Product A sells for ?10 and product B sells for ?9. Fixed costs for the company are ?220,000.
- What is the contribution margin per composite unit?
- What is the break-even point in composite units?
- How many units of product A and product B will the company sell at the break-even point?
Solution
A.
B.
Break-even per composite unit = 15,385.
C.
Key Concepts and Summary
- Companies provide multiple products, goods, and services to the consumer and, as result, need to calculate their break-even point based on the mix of the products, goods, and services.
- In a multi-product environment, calculating the break-even point is more complex and is usually calculated using a composite unit, which represents the sales mix of the business.
- If the sales mix of a company changes, then the break-even point changes, regardless of whether total sales dollars change or not.
(Figure)If the sales mix in a multi-product environment shifts to a higher volume in low contribution margin products, the break-even point will ________.
- remain unchanged because all products are included in the calculation of break-even
- increase because the low contribution margin products have little effect on break-even
- increase because the per composite unit contribution margin will decrease
- decrease because the per composite unit contribution margin will increase
C
(Figure)Break-even for a multiple product firm ________.
- can be calculated by dividing total fixed costs by the contribution margin of a composite unit
- can be calculated by multiplying fixed costs by the contribution margin ratio of a composite unit
- can only be calculated when the proportion of products sold is the same for all products
- can be calculated by multiplying fixed costs by the contribution margin ratio of the most common product in the sales mix
(Figure)Waskowski Company sells three products (A, B, and C) with a sales mix of 3:2:1. Unit sales price are shown. What is the sales price per composite unit?
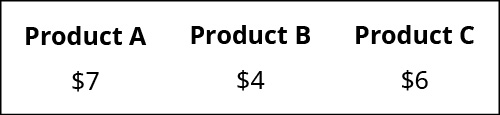
- ?17.00
- ?25.00
- ?35.00
- ?20.00
C
(Figure)Beaucheau Farms sells three products (E, F, and G) with a sale mix ratio of 3:1:2. Unit sales price are shown. What is the sales price per composite unit?
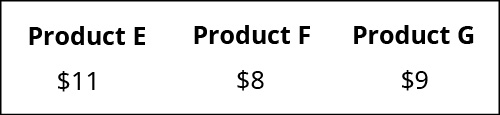
- ?28.00
- ?20.00
- ?59.00
- ?41.00
(Figure)A company sells two products, Model 101 and Model 202. For every one unit of Model 101, they sell they sell two units of Model 202. Sales and cost information for the two products is shown. What is the contribution margin for a composite unit based on the sales mix?
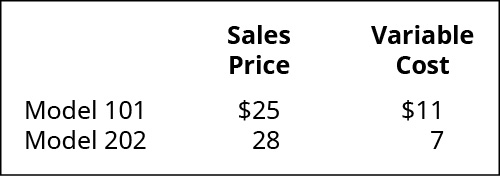
- ?14
- ?21
- ?35
- ?56
D
(Figure)Explain what a sales mix is and how changes in the sales mix affect the break-even point.
Answers will vary. Responses should include the definition of sales mix as the relative proportions in which a company’s products are sold as well as a description of how products within the sales mix have unique sales prices, variable costs, and contribution margins.
(Figure)Explain how break-even analysis for a multi-product company differs from a company selling a single product.
(Figure)Salvador Manufacturing builds and sells snowboards, skis and poles. The sales price and variable cost for each are shown:
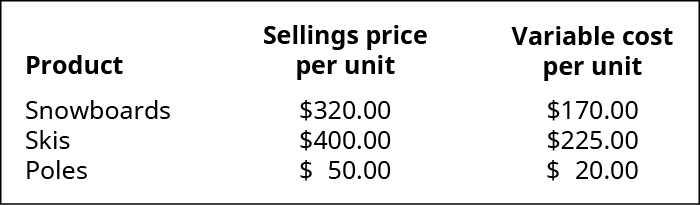
Their sales mix is reflected in the ratio 7:3:2. What is the overall unit contribution margin for Salvador with their current product mix?
(Figure)Salvador Manufacturing builds and sells snowboards, skis and poles. The sales price and variable cost for each follows:
Their sales mix is reflected in the ratio 7:3:2. If annual fixed costs shared by the three products are ?196,200, how many units of each product will need to be sold in order for Salvador to break even?
(Figure)Use the information from the previous exercises involving Salvador Manufacturing to determine their break-even point in sales dollars.
(Figure)JJ Manufacturing builds and sells switch harnesses for glove boxes. The sales price and variable cost for each follows:
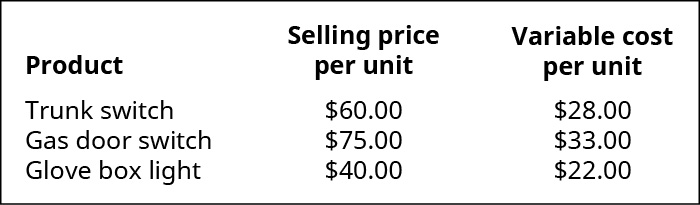
Their sales mix is reflected in the ratio 4:4:1. What is the overall unit contribution margin for JJ Manufacturing with their current product mix?
(Figure)JJ Manufacturing builds and sells switch harnesses for glove boxes. The sales price and variable cost for each follow:
Their sales mix is reflected in the ratio 4:4:1. If annual fixed costs shared by the three products are ?18,840 how many units of each product will need to be sold in order for JJ to break even?
(Figure)Use the information from the previous exercises involving JJ Manufacturing to determine their break-even point in sales dollars.
(Figure)Morris Industries manufactures and sells three products (AA, BB, and CC). The sales price and unit variable cost for the three products are as follows:
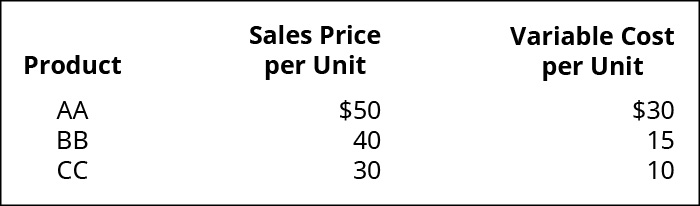
Their sales mix is reflected as a ratio of 5:3:2. Annual fixed costs shared by the three products are ?258,000 per year.
- What are total variable costs for Morris with their current product mix?
- Calculate the number of units of each product that will need to be sold in order for Morris to break even.
- What is their break-even point in sales dollars?
- Using an income statement format, prove that this is the break-even point.
(Figure)Manatoah Manufacturing produces 3 models of window air conditioners: model 101, model 201, and model 301. The sales price and variable costs for these three models are as follows:
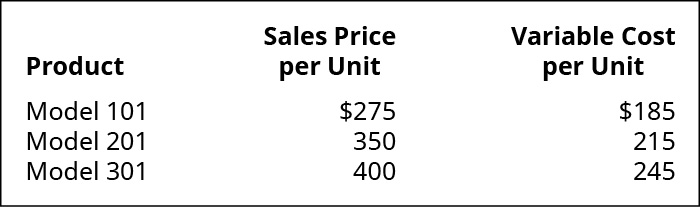
The current product mix is 4:3:2. The three models share total fixed costs of ?430,000.
- Calculate the sales price per composite unit.
- What is the contribution margin per composite unit?
- Calculate Manatoah’s break-even point in both dollars and units.
- Using an income statement format, prove that this is the break-even point.
(Figure)Abilene Industries manufactures and sells three products (XX, YY, and ZZ). The sales price and unit variable cost for the three products are as follows:
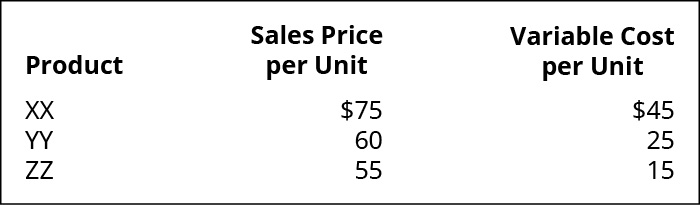
Their sales mix is reflected as a ratio of 4:2:1. Annual fixed costs shared by the three products are ?345,000 per year.
- What are total variable costs for Abilene with their current product mix?
- Calculate the number of units of each product that will need to be sold in order for Abilene to break even.
- What is their break-even point in sales dollars?
- Using an income statement format, prove that this is the break-even point.
(Figure)Tim-Buck-II rents jet skis at a beach resort. There are three models available to rent: Junior, Adult, and Expert. The rental price and variable costs for these three models are as follows:
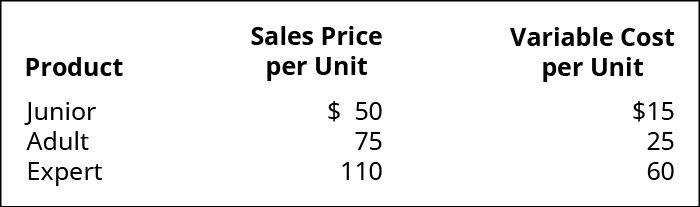
The current product mix is 5:4:1. The three models share total fixed costs of ?114,750
- Calculate the sales price per composite unit.
- What is the contribution margin per composite unit?
- Calculate Tim-Buck-II’s break-even point in both dollars and units.
- Using an income statement format, prove that this is the break-even point.
Glossary
- composite unit
- selection of discrete products associated together in relation or proportion to their sales mix
- multi-product environment
- business environment in which a company sells different products, manufactures different products, or offers different types of services
- sales mix
- relative proportions of the products that a company sells
