
36 Describe and Identify Cost Drivers
Patty Graybeal
As you’ve learned, the most common bases for predetermined overhead are direct labor hours, direct labor dollars, or machine hours. Each of these costs is considered a cost driver because of the causal relationship between the base and the related costs: As the cost driver’s usage increases, the cost of overhead increases as well. (Figure) shows various costs and potential cost drivers.
| Common Manufacturing Expenses and Potential Cost Drivers | |
|---|---|
| Common Expenses | Potential Cost Drivers |
|
|
The more accurately a company can determine the cost drivers for its products, the more accurate the costing information will be, which in turn allows management to make better use of the cost data in making decisions. As technology changes, however, the mix between materials, labor, and overhead changes. Often, improved technology means less waste of material and fewer direct labor hours, but possibly more overhead. For example, technology has changed the way pharmaceuticals are manufactured. Advancing technology allows for the now smaller labor force to be more productive than a larger labor force from earlier years. While the labor cost has changed, this decrease may only be temporary as a labor force with higher costs and different skills is often needed. Additionally, an increase in technology often raises overhead costs. How accurate, then, is the company’s product cost information if it has become more efficient in its production process? Should the company still be using a predetermined overhead application rate based on direct labor hours or machine hours? A detailed analysis of the cost drivers will answer these questions.
Another benefit of looking at cost drivers is that doing so allows a company to analyze all costs. A company can differentiate among costs that drive overhead and have value, those that do not drive overhead but still add value, and those that may or may not drive the overhead but do not add any value. For example, a furniture manufacturer produces and sells wooden tables in various colors. The painting process involves a white base coat, a color coat, and a clear protective top coat. The three coats are applied in a sealed room using a spraying process followed by an ultraviolet drying process. The depreciation on the spraying machines and the ultraviolet bulbs used in the painting process are overhead costs. These costs drive or increase overhead, and they add value to the product by increasing the quality. Costs associated with repainting or fixing any blemishes are overhead costs that are necessary to sell the product but would not be considered value-added costs. The goal is to eliminate as many of the non-value-added costs as possible and subsequently reduce overhead costs.
Cost Drivers and Overhead
In today’s production environment, there are many activities within the production process that can contribute to the cost of the product, but determining the cost drivers may be complicated because some of those activities may change over time. Additionally, the appropriate level of assigning cost drivers needs to be determined. In some cases, overhead costs such as inspection increase with each unit inspected, and the costs need to be allocated on a per-unit level. In other cases, the overhead costs, such as machine setup costs, are incurred each time a batch of products is manufactured and need to be allocated at the batch level.
For example, the labor hours for the staff taking, fulfilling, and inspecting orders may increase as the number of orders increases, driving up the overhead. Furthermore, the costs of taking orders or of quality inspections can vary per product and may not be captured properly. Technology improvements, including switching to automated processes for production, may decrease the labor hours of the production staff, driving the labor-related overhead downward but potentially increasing other overhead expenses. These activities—order taking, fulfillment, and quality inspections—are potential cost drivers associated with production, and they each drive the overhead at varying rates.
Cost drivers vary widely among companies.
- After costs are accumulated into cost pools, what information would help management select the appropriate cost driver?
- Name an appropriate cost driver for each of the following cost pools:
- Plant cleaning and maintenance
- Factory supervision
- Machine maintenance
- Machine setups
Identify Cost Drivers
How does a company determine its cost drivers for indirect materials, indirect labor, and other overhead costs? To begin the determination of appropriate cost drivers, an accountant analyzes the activities in the product production process that contribute to the cost of that product. An activity is any action that consumes company resources, such as taking orders for a product, setting up machines to produce the product, inspecting the product, and providing customer support before and through the order process. For example, Musicality’s direct costs can be traced to the products, but there are indirect costs associated with using various types of material for each product. While the Orchestra product has more intricate materials and labor, it has fewer costs associated with requisitioning and conveying materials to the production line than the other products have. Additionally, examining the inspection costs indicates the Orchestra product is a simple product to inspect, so random quality inspections are sufficient. But individual inspections for both the Solo and Band products are critical, and the overhead related to inspection costs should be based on the number of inspections.
As you can imagine, the unique aspects of the production process for each product affect the overhead cost of each product. However, these costs may not be allocated to the products appropriately when overhead is applied using a predetermined rate based on one activity. While Solo, Band, and Orchestra might appear to be different only in quality, they are actually very different from each other when it comes to manufacturing overhead costs.
Whether the products produced require significantly different overhead resources or not, the company benefits from understanding what its cost drivers are. The more efficiently each product’s activities are tracked, the more actual cost drivers are discovered, and the more accurately overhead can be assigned to each product.
The value of analyzing cost drivers can be used in budgeting beyond allocating overhead to products. American Express has forums designed to help small businesses be successful. Knowing the cost drivers for your business can help with budgeting. American Express states that all business activities are related to five main cost drivers:1
- Employee head count is often the driver for office supply expense.
- Salesperson head count is often the driver for auto and other employee travel expense.
- The number of leads required to reach the target sales goal is often the driver for advertising, public relations, social media, search engine optimization expense, and other expenses associated with generating leads.
- Sales and all related variable expenses are often the driver for commissions, bad debt, insurance expense, and so on.
- Fixed costs, such as postage, web hosting fees, business licenses, and banking fees, are often overlooked as cost drivers.
Key Concepts and Summary
- Overhead costs are analyzed and grouped based on similar activity bases. A cost driver, such as inspections, machine setups, or order taking, is selected for each cost grouping.
- Analysis of cost drivers allows for better selection of true overhead cost drivers and more appropriate allocation of overhead.
(Figure)Which is not a step in analyzing the cost driver for manufacturing overhead?
- identify the cost
- identify non-value-added costs
- analyze the effect on manufacturing overhead
- identify the correlation between the potential driver and manufacturing overhead
B
(Figure)Overhead costs are assigned to each product based on ________.
- the proportion of that product’s use of the cost driver
- a predetermined overhead rate for a single cost driver
- price of the product
- machine hours per product
(Figure)What is the advantage of labeling activities as value added or nonvalue added?
Non-value-added costs can often be eliminated since they are rarely essential, and identifying them helps managers reduce their costs.
(Figure)What conditions are necessary to designate an activity as a cost driver?
(Figure)For each cost pool, identify an appropriate cost driver.
- order department
- accounts receivable processing
- catering
- raw material inventory
Answers may vary but should be similar to the following: A. number of orders; B. number of customers; C. number of meals; D. number of material requisitions received.
(Figure)Identify appropriate cost drivers for these cost pools:
- setup cost pools
- assembly cost pool
- supervising cost pool
- testing cost pool
(Figure)Match the activity with the most appropriate cost driver.
| Activities and Cost Drivers | |
|---|---|
| Activity | Cost Driver |
| Fringe benefits | Square feet |
| Electricity | Direct labor hours |
| Depreciation | Machine hours |
| Machine maintenance | |
| Heat and air conditioning | |
(Figure)Identify appropriate cost drivers for these cost pools:
- material cost pool
- machine cost pool
- painting cost pool
- maintenance cost pool
(Figure)Match the activity with the most appropriate cost driver.
| Activities and Cost Drivers | |
|---|---|
| Activity | Cost Driver |
| Factory maintenance | Number of setups |
| Payroll tax | Number of employees |
| Rent | Square feet |
| Machine setups | Direct labor hours |
| Factory supervision | |
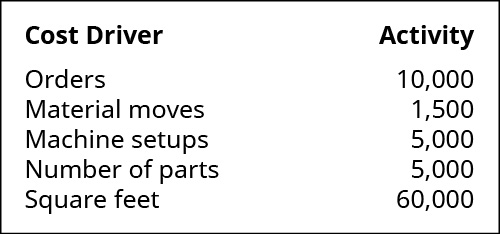
(Figure)A local picnic table manufacturer has budgeted these overhead costs:
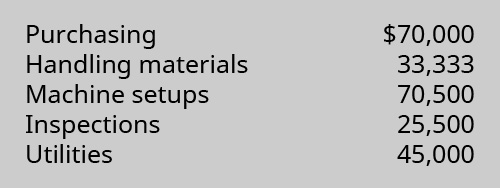
They are considering adapting ABC costing and have estimated the cost drivers for each pool as shown:
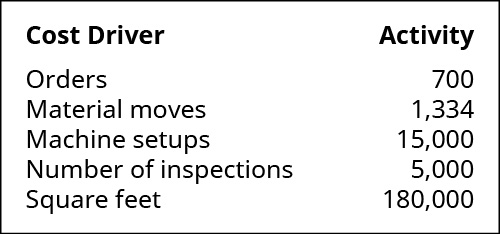
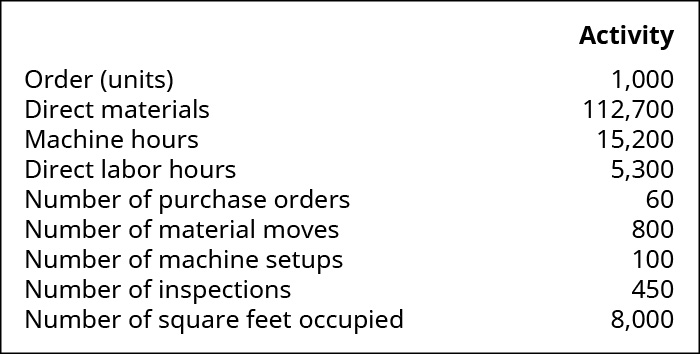
Recent success has yielded an order for 1,000 tables. Assume direct labor costs per hour of $20. Determine how much the job would cost given the following activities:
(Figure)Explain how each activity in this list can be associated with the corresponding unit or batch level provided.
- Assembling products: unit level
- Issuing raw materials: batch level
- Machine setup: batch level
- Inspection: unit level
- Loading the labeling machine: batch level
- Equipment maintenance: batch level
- Printing a banner: unit level
- Moving material: batch level
- Ordering a part: batch level
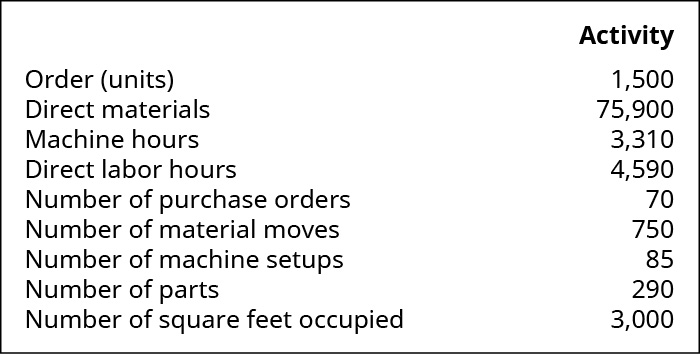
(Figure)A local picnic table manufacturer has budgeted the following overhead costs:
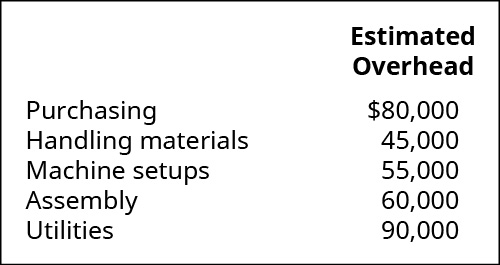
They are considering adapting ABC costing and have estimated the cost drivers for each pool as shown:
Recent success has yielded an order for 1,500 tables. Determine how much the job would cost given the following activities, and assuming an hourly rate for direct labor of $25 per hour:
(Figure)Explain how each activity in this list can be associated with the corresponding unit or batch level provided.
- Assembling products: batch level
- Issuing raw materials: unit level
- Machine setup: unit level
- Inspection: batch level
- Loading the labeling machine: unit level
- Equipment maintenance: unit level
- Printing a banner: batch level
- Moving material: unit level
- Ordering a part: unit level
(Figure)College Cases sells cases for electronic devices such as phones, computers, and tablets. These cases have college logos or mascots on them and can be customized by adding such things as the customer’s name, initials, sport, or fraternity letters. The company buys the cases in various colors and then uses laser technology to do the customization of the letters and to add school names, logos, mascots, and so on. What are potential activity-based costing pools for College Cases, and what would be appropriate cost drivers?
Footnotes
- 1 American Express. “5 Cost Drivers to Help You Make Accurate Expense Projections.” June 23, 2011. https://www.americanexpress.com/us/small-business/openforum/articles/5-cost-drivers-to-help-you-make-accurate-expense-projections/
Glossary
- cost driver
- activity that is the reason for the increase or decrease of another cost; examples include labor hours incurred, labor costs paid, amounts of materials used in production, units produced, or any other activity that has a cause-and-effect relationship with incurred costs
