
55 Describe the Types of Responsibility Centers
Patty Graybeal
You’ve learned how segments are established within a business to increase decision-making and operational effectiveness and efficiency. In other words, segments allow management to establish a structure of operational accountability.
The terminology changes slightly when we think about accountability relating to the financial performance of the segment. In a decentralized organization, the system of financial accountability for the various segments is administered through what is called responsibility accounting.
Responsibility accounting is a basic component of accounting systems for many companies as their performance measurement process becomes more complex. The process involves assigning the responsibility of accounting for particular segments of the company to a specific individual or group. These segments are often structured as responsibility centers in which designated supervisors or managers will have both the responsibility for the performance of the center and the authority to make decisions that affect the center.
Often, businesses will use the segment structure to establish the responsibility accounting framework. You might think of segments and responsibility centers as two sides of the same coin: segments establish the structure for operational accountability whereas responsibility centers establish the structure for financial accountability. Both segments and responsibility centers (which will likely be the same) attempt to accomplish the same goal: ensure all sectors of the business achieve the organization’s strategic goals.
Before learning about the five types of responsibility centers in detail, it is important to understand the essence of responsibility accounting and responsibility centers.
Fundamentals of Responsibility Accounting and Responsibility Centers
Recall the discussion of management control systems. These systems allow management to establish, implement, monitor, and adjust the activities of the organization toward attainment of strategic goals. Responsibility accounting and the responsibility centers framework focuses on monitoring and adjusting activities, based on financial performance. This framework allows management to gain valuable feedback relating to the financial performance of the organization and to identify any segment activity where adjustments are necessary.
Types of Responsibility Centers
Organizations must exercise care when establishing responsibility centers. In a responsibility accounting framework, decision-making authority is delegated to a specific manager or director of each segment. The manager or director will, in turn, be evaluated based on the financial performance of that segment or responsibility center. It is important, therefore, to establish a responsibility accounting framework that allows for an adequate and equitable evaluation of the financial performance of the responsibility center (and, by default, the manager of the responsibility center) as well as the attainment of the organization’s strategic goals.
This is not an easy task. There are several factors that organizations must consider when developing and using a responsibility accounting framework. Before discussing those factors, let’s explore the five types of responsibility centers: cost centers, discretionary cost centers, revenue centers, profit centers, and investment centers.
Cost Centers
A cost center is an organizational segment in which a manager is held responsible only for costs. In these types of responsibility centers, there is a direct link between the costs incurred and the product or services produced. This link must be recognized by managers and properly structured within the responsibility accounting framework.
An example of a cost center is the custodial department of a department store called Apparel World. On one hand, since the custodial department is structured as a cost center, the goal of the custodial department manager is to keep costs as low as possible, since this is the basis by which the manager will be evaluated by upper-level management. On the other hand, the custodial department manager, who is responsible for cleaning the store entrances, also wants to keep the store as clean as possible for the store’s customers. If the store appears unclean and disorganized, customers will not continue to shop at the store. Therefore, the custodial department manager and upper-level management must work together to establish goals of the cost center (the custodial department, in this example) that satisfy the strategic goals of the business—maintaining a clean and organized store while minimizing the costs of managing the custodial department.
(Figure) shows an example of what the cost center report might look like for the Apparel World custodial department.
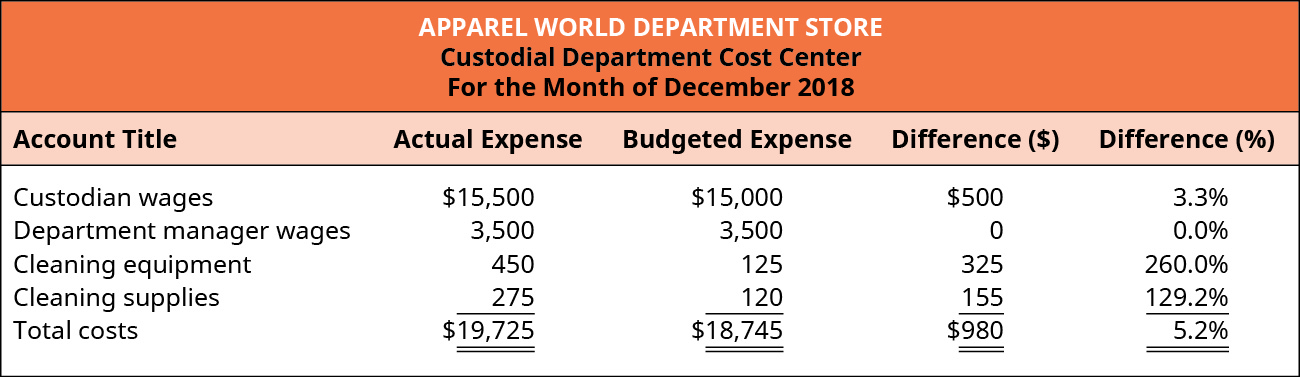
Let’s use this report to explore how the department manager and upper-level management might review and use this information. In total, in December, the custodial department incurred $980 more of actual expenses than budgeted (or expected) expenses. This represents a 5.2% increase in expenses than was expected.
Notice the terminology used to describe the financial information of the custodial department: the department “incurred $980 more of actual expenses,” rather than the department “spent $980 more of actual expenses.” Recall from Introduction to Financial Statements that financial statements are typically prepared using accrual accounting rather than cash accounting. Under accrual accounting, certain transactions are recorded regardless of when the cash is exchanged. Therefore, to say the custodial department “spent $19,725” or “spent $980 more for expenses” would technically be incorrect, since the cash may not have been spent.
The managers would then review each line item to determine what caused the $980 increase in expenses over what was expected. Keep in mind, the $980 represents the total overage from the budget, so it is possible that some expense accounts could have actually been below expectations. Unfortunately, that is not the case in the month of December because every line item, with the exception of department manager wages, exceeded the budgeted amount. It was no surprise to management that the department manager’s wages were exactly as expected. Even though the custodial department manager worked more hours in the month of December, the manager is a salaried employee, so the wages are the same regardless of the number of hours worked.
Upon further investigation, it was determined that in December, the town where the Apparel World store is located received an unusually high amount of snow. This had an impact on each of the expense amounts in the custodial department. Because of the need to shovel snow more often, some of the custodial staff had to work overtime to ensure customers could easily and safely enter the store. This led to an increase in custodial wages of $500 compared to the budgeted or expected amount, which was established based on the previous year, when snowfall in the area was closer to average.
The research conducted by management also identified that additional cleaning equipment (mop buckets, mops, and “wet floor” signs) were purchased. The increased snowfall also led to the purchase of more salt than usual for the sidewalks outside the store. Because it was important to promptly clean the snow as well as the salt that was brought into the store on customers’ shoes, additional equipment was purchased so that each entrance would have a mop and bucket. The custodial department manager decided this was the best course of action. Normally, the store uses a single mop and bucket to clean all entrances. This would have taken more time and increased the risk of an accident.
The increased application of salt partially explains the 129.2% (or $155) overage in the cleaning supplies expense account. Management has learned that the overage in this account was also caused by an increase in purchases of mop head replacements, floor cleaner, and paper towels.
After reviewing the December information and learning the causes of the increased expenses, the company determined that no corrective action was necessary going forward. The area received an unusually high level of snowfall that year, which was not something the custodial department manager could control. In fact, the upper-level managers praised the custodial department manager for taking action that was in the best interest of the store and its customers. The managers commented that they had received numerous compliments from customers regarding how easy and safe it was to enter the store compared to other local stores. The manager noted that, despite the increased snowfall, store sales were higher than expected and attributed much of the success to the work of the custodial department.
Discretionary Cost Centers
A discretionary cost center is similar to a cost center, with one distinguishing factor. A discretionary cost center is an organizational segment in which a manager is held responsible for controllable costs when there is not a well-defined relationship between the center’s costs and its services or products. Examples include human resources and accounting departments. Human resources departments often establish policies that affect the entire organization. For instance, while a policy requiring all workers to have annual safety training for fires, injuries, and tornadoes is beneficial to the entire company, it is difficult to evaluate the human resources department manager’s performance in relation to impacting the products or services the company provides. As you might expect, reviewing the financial performance of a discretionary cost center is similar to that of the review of a cost center.
Revenue Centers
A revenue center is an organizational segment in which a manager is held accountable only for revenues. As the name implies, the goal of a revenue center is to generate revenues for the business. In order to accomplish the goal of increasing revenues, the manager of a revenue center would focus on developing specific skillsets of the revenue center’s employees. The reservations group of Southwest Airlines is an example of a segment that may be structured as a revenue center. The employees should be well-trained in providing excellent customer service, handling customer complaints, and converting customer interactions into actual sales. As the financial performance of cost centers and discretionary cost centers is similar, so is the financial performance of a revenue center and a cost center.
Profit Centers
A profit center is an organizational segment in which a manager is responsible for both revenues and costs (such as a Starbucks store location). Of the responsibility centers explored so far, a profit center structure is the most complex because a manager must be well-versed in techniques to increase revenues, decrease expenses, and thereby increase profits while also meeting the strategic goals of the organization.
Let’s return to the Apparel World department store. (Figure) shows an example of what the profit center report might look like for the Apparel World children’s clothing department.
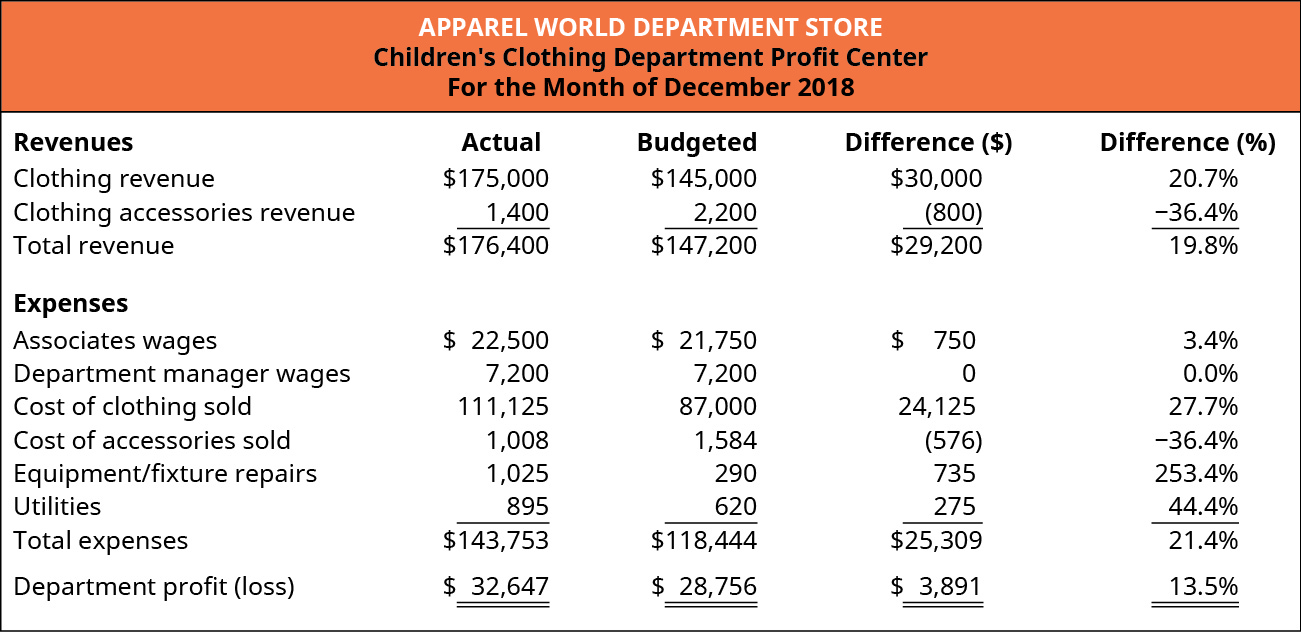
Just as with the cost center, let’s walk through an analysis of the December children’s clothing department profit center report. Overall, the department’s actual profit exceeded budgeted profit by $3,891, or 13.5%, compared to budgeted (or expected) profit. This increase was driven by a total revenue increase over budget by $29,200 or 19.8%. Recall from Building Blocks of Managerial Accounting that variable costs, unlike fixed costs, change in proportion to the level of activity in a business. Therefore, it should be no surprise that the expenses in the children’s clothing department also increased. In fact, the expenses increased $25,309 (or 21.4%) versus the budgeted amount. The revenues of the department increased $29,200, while expenses increased $25,309, yielding an increase in profit of $3,891 over expectations.
The increase in revenue could be further analyzed. Because the store also sells accessories such as belts and socks, the children’s clothing department tracks two revenue sources (also called streams)—clothing and accessories. Management was pleased to learn that clothing revenue exceeded expectations by $30,000, or 20.7%. Given the higher-than-usual level of snowfall in the area, this is an impressive increase, and the company can attribute a portion of the successful month to the employees of the custodial department, who worked extra hard to ensure customers could easily and safely enter the store.
The overall revenue of the department increased by $29,200. Since the clothing department revenue increased by $30,000, the clothing accessories revenue stream must have experienced a decline in revenue. In fact, the accessories revenue dropped by 36.4%. While this is a large percentage, consider the fact that the actual value of revenue decline was relatively minor—only $800 lower (as indicated by the negative amount) than expected. This indicates the employees may not have encouraged customers to also get belts or socks with their clothing purchase. This is an opportunity for the department manager to remind employees to encourage customers to purchase accessories to complement the clothing purchases. Overall, the increase in revenue attained by the children’s clothing department is a highlight for the store.
A review of the department’s expenses shows increases in all expenses, except department manager wages and cost of accessories sold. When reviewing the profit center report, pay special attention to how the differences between the actual and budgeted expenses are calculated in this analysis. In the revenue section, a positive number indicates the revenue exceeded the budgeted amount, which means a favorable financial performance. In the expense section, a positive number indicates the expense exceeded the budgeted amount, which means an unfavorable financial performance.
As with the custodial department manager, the manager of the children’s clothing department is also a salaried employee, so the wages do not change each month—the wages are a fixed cost for the department. Since the clothing accessories revenue declined, the cost of accessories also declined. The accessories expenses were $576 lower than expected. While this appears to be good news for the department, recall that clothing accessories revenue dropped by $800. Therefore, the department profit margin decreased by a net amount of $224 versus expectations ($800 revenue decline and a corresponding expense decrease of $576).
All other actual expenses were over budget, as indicated by the positive numbers. Remember, these are expenses, and in this analysis, they indicate unfavorable financial performance. It probably comes as no surprise that all of the expense overages are a result of the increased sales. Because of the increased sales, more associates were needed to cover each shift, and they worked more hours to cover the longer store hours, which caused wages to go over budget. The substantial increase in clothing revenue also caused the cost of clothing sold to increase proportionately. Similarly, the increased sales drove an increase in equipment/fixture repairs of $735 (or 253.4%) over budget due to repairs to cash registers and clothing racks. Because the store was open longer hours during the holiday season, the utilities expenses also exceeded budget by $275, or 44.4%.
Overall, the Apparel World department store management was pleased with the December financial performance of the children’s clothing department. The department exceeded budgeted sales, which resulted in an increase in department profitability. The review also highlighted an area for improvement in the department—increasing accessory sales—which is easily corrected through additional training.
Notice that the review of the children’s clothing department profit center report discussed differences measured in both dollars and percentages. When analyzing financial information, looking only at dollar values can be misleading. Displaying information as percentages—percentage of an entire amount or percentage change—standardizes the information and facilitates an easier and more accurate comparison, especially when dealing with segments (or companies) with vastly different sizes.
Let’s look at another scenario using Apparel World. The example so far has explored the financial performance review processes for a cost center and a profit center. Now assume that store management wants to compare two different profit centers—children’s clothing and women’s clothing. (Figure) shows the December financial information for the children’s clothing department, and (Figure) shows the financial information for the women’s clothing department.

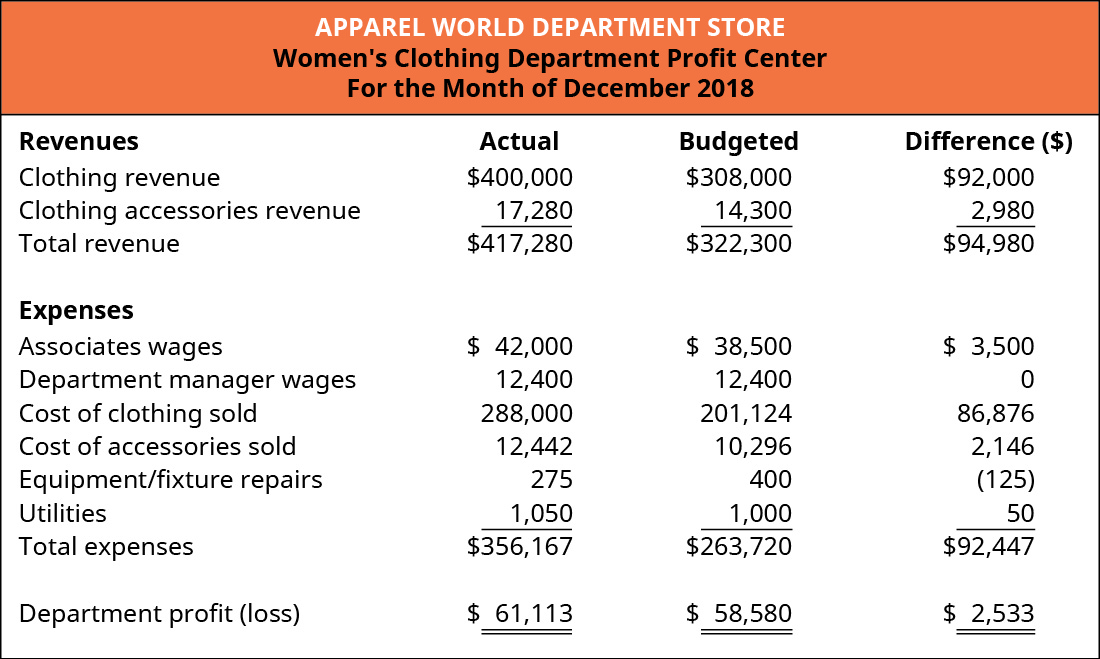
Comparing the dollar differences in the two departments, notice that the children’s clothing department is a smaller department, as measured by total revenue, than the women’s clothing department.
Now, let’s compare the differences in the two departments by looking at the percentages. The children’s clothing department financial information is shown in (Figure), and the women’s clothing department financial information is shown in (Figure).
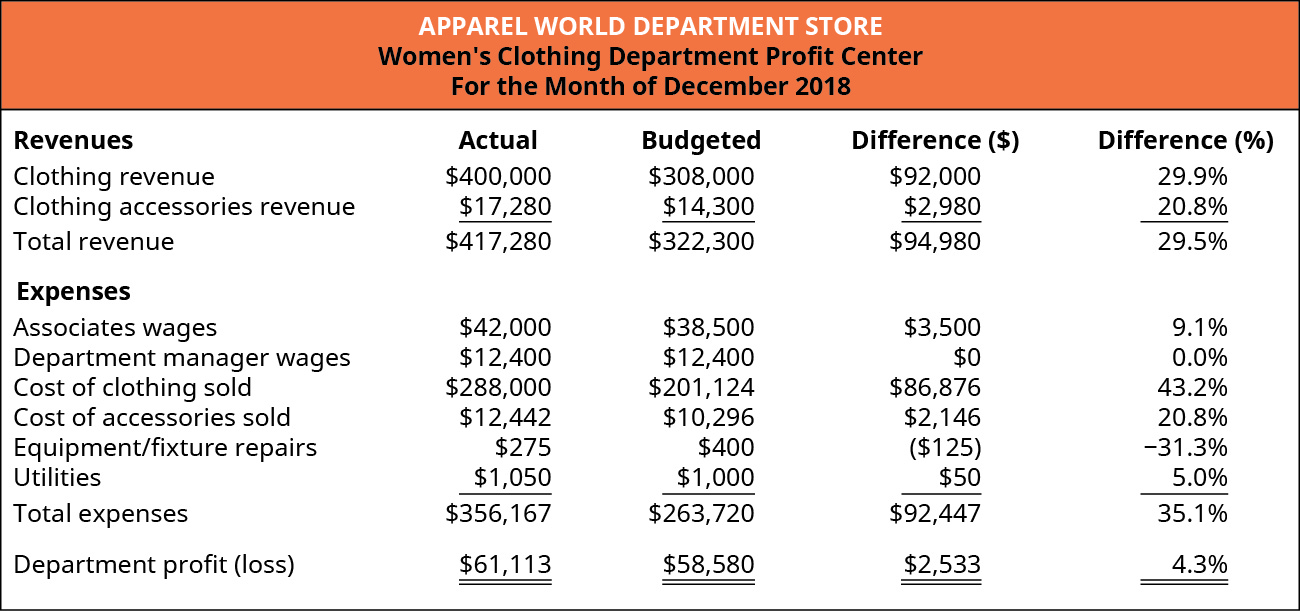
Does the comparison change when the dollar differences are shown as percentages? Which department was more effective at strengthening the store’s financial position? Which department was more efficient with the December revenue? What other factors might the Apparel World management consider?
Adding the percentages to the financial analysis allows managers to more directly make comparisons, to separate departments in this case. Simply reviewing the dollar differences can be misleading because of size differences between the departments being compared. The Women’s Department added more value ($61,113) to the store’s financial position, while the Children’s Department was more efficient, converting 13.5% (or $0.135) of every dollar of revenue to profit.
Investment Centers
It is important for managers to continually invest in the business. Managers must choose investments that improve the value of the business by improving the customer experience, increasing customer loyalty, and, ultimately, increasing the value of the organization. A limitation of the centers explored so far—cost center, discretionary cost center, revenue center, and profit center—is that these structures do not account for the investments made by the various responsibility center managers. The final responsibility center—investment centers—takes into account and evaluates the investments made by the responsibility center managers. The goal of the investment center structure is to ensure that segment managers choose investments that add value and help the organization achieve its strategic goals.
An investment center is an organizational segment (such as the northern region of Best Buy or the food trucks used in the Why It Matters opening case) in which a manager is accountable for profits (revenues minus expenses) and the invested capital used by the segment.
As you know by now, financial statements tell users what has occurred in the past—the statements provide feedback value. Responsibility accounting is no exception—it is a system that measures the financial performance of what has already occurred and provides management with a measure of past events.
Have you ever considered how companies measure the outcome of activities that have not yet occurred? As you’ve learned, many companies invest in research and development activities to determine how to improve existing products and to create entirely new products or processes.
The Hershey Chocolate Company is one company that invests heavily in research and development. Hershey’s has created an Advanced Technology & Foresight Lab, which looks for innovative ways to bring chocolate to the market.
Here are some of the innovative things that Hershey’s has developed:
- Sourcemap—an interactive, web-based tool to show consumers where the ingredients in their favorite Hershey’s snack, such as Hershey’s Milk Chocolate with Almonds Bar comes from. There is also a video and short story for each point on the interactive map for more information.
- SmartLabel—a scanable label on each Hershey’s product that gives the user up-to-date ingredient, allergen, and other information.
- Chocolate made inside the package—Hershey’s developed this process to form a piece of chocolate inside the package.
- 3D Chocolate Printing—using a 3D printer, Hershey’s has developed an innovative way to create customized chocolate candies.1
Measuring the financial success of innovations such as these is nearly impossible in the short-run. However, in the long-run, investments in product development help companies like Hershey’s increase sales, reduce costs, gain market share, and remain competitive in the marketplace.
There are numerous methods used to evaluate the financial performance of investment centers. When discussing profit centers, we used the segment’s profit/loss stated in dollars. Another method to evaluate segment financial performance involves using the profit margin percentage.
The profit margin percentage is calculated by taking the net profit (or loss) divided by the net sales. This is a useful calculation to measure the organization’s (or segment’s) efficiency at converting revenue into profit (net income). While the dollar value of a segment’s profit/loss is important, the advantage of using a percentage is that percentages allow for more direct comparisons of different-sized segments.
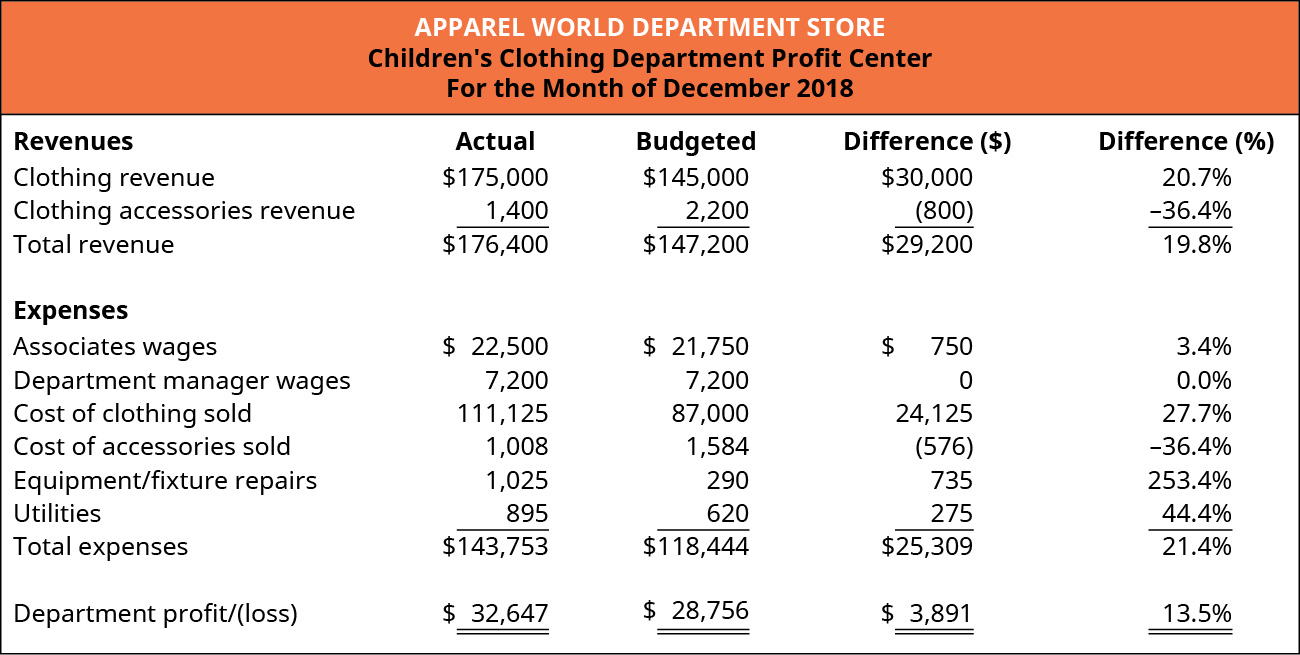
Let’s return to the Apparel World example and look at the profit margin percentage for the children’s and women’s clothing departments. (Figure) shows the December financial information for the children’s clothing department, including the profit margin percentage.
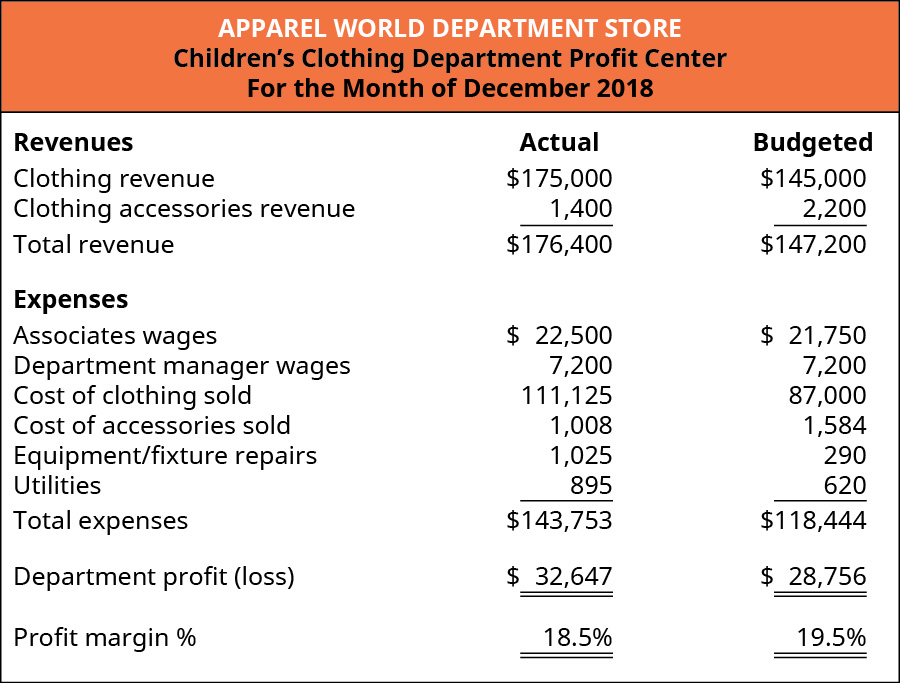
The actual profit margin percentage achieved by the children’s clothing department was 18.5%, calculated by taking the department profit of $32,647 divided by the total revenue of $176,400 ($32,647 / $176,400). The actual profit margin percentage was slightly lower than the expected percentage of 19.5% ($28,756 / $147,200). To determine why the profit margin percentage slipped slightly compared to expectations, management could compare the actual revenue and expenses with the budgeted revenue and expenses using a vertical analysis, as shown in Financial Statement Analysis. Doing so would highlight the fact that the cost of clothing sold as a percentage of clothing revenue increased significantly compared to what was expected. Management would want to explore this further, looking at factors influencing both clothing revenue (sales prices and quantity) and the cost of the clothing (which may have increased).
(Figure) shows the December financial information for the women’s clothing department, including the profit margin percentage.
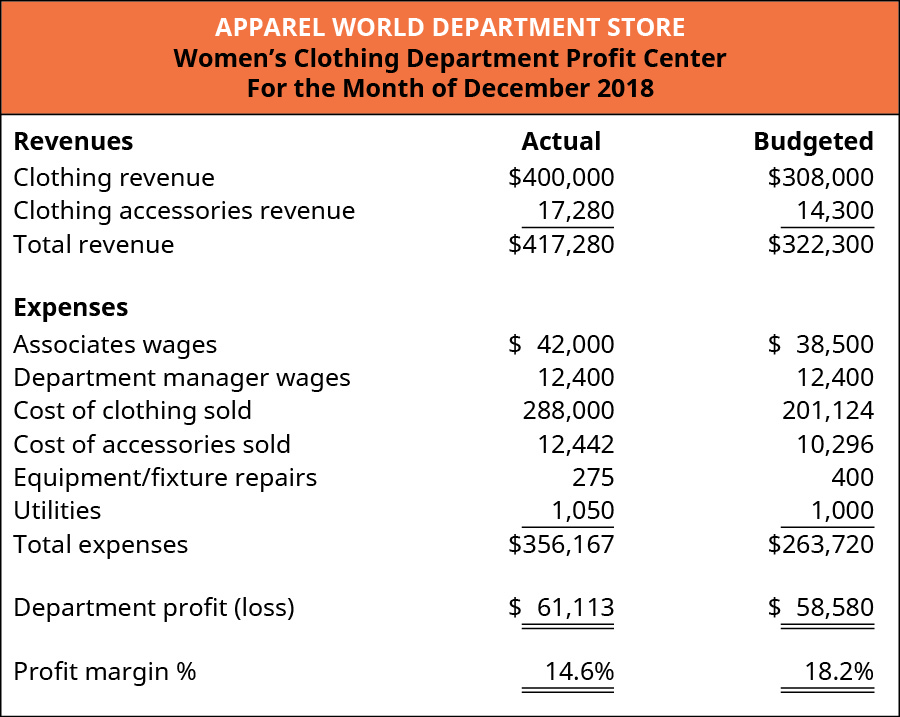
The actual profit margin percentage of the women’s clothing department was 14.6%, calculated by taking the department profit of $61,113 divided by the total revenue of $417,280 ($61,113 / $417,280). The actual profit margin percentage was significantly lower than the expected percentage of 18.2% ($58,580 / $322,300). As with the children’s clothing department, a vertical analysis indicates the significant decrease from budgeted profit margin percentage was a result of the cost of clothing sold. This would lead management to investigate possible causes that would have influenced the clothing revenue (sales prices and quantity), the cost of the clothing, or both.
Another method used to evaluate investment centers is called return on investment. Return on investment (ROI) is the department or segment’s profit (or loss) divided by the investment base (Net Income / Base). It is a measure of how effective the segment was at generating profit with a given level of investment. Another way to think about ROI is its use as a measure of leverage. That is, the return on investment calculation measures how much profit the segment can realize per dollar invested.
Several points are in order regarding the definition of return on investment. In practice, the numerator (segment profit or loss) may have different names, depending upon the terms used by the organization. Some organizations may call this value net income (or loss) or operating income (or loss). These terms relate to the financial performance of the segment, and each organization decides how best to identify and quantify financial performance.
Another significant point in the definition of return on investment relates to the denominator (investment base). There is no uniform definition of “investment base” within the accounting/finance profession. Some organizations define investment base as operating assets, while others define the investment base as average operating assets. Other organizations use the book value of assets, and still others use the historical or even replacement cost of assets. There are valid arguments for all of these definitions for investment base. It is important not to be confused by these variations but instead to know the definition in a particular context and to use it consistently. For our purposes, the denominator in the return on investment formula will be “investment base,” and the value will be provided.
Finally, you may recall from Long-Term Assets that accountants carefully consider where to place certain costs (either on the balance sheet as assets or on the income statement as expenses). While ROI typically deals with long-lived assets such as buildings and equipment that are charged to the balance sheet, the ROI approach also applies to certain “investments” that are expensed. For instance, advertising costs are expensed. If a segment is considering an advertising campaign, management would assess the effectiveness of the advertising campaign in a similar manner as the traditional ROI analysis using large, capitalized investments. That is, management would want to assess the additional revenue (or profit) derived from the advertising campaign (which would be the numerator in the ROI calculation) compared to the investment or cost of the advertising campaign (which would be the denominator in the ROI calculation). To illustrate, let’s say management was able to identify that an advertising campaign costing $2,500 brought in an additional $500 of profit. This would be a 20% return on investment ($500 / $2,500).
A return on investment analysis of an investment center begins with the same information as an analysis of a profit center. To explore return on investment, let’s return to the December Apparel World profit center information analyzing the children’s and women’s clothing departments. Assume that a smaller store in another location had the following profit for December:
- Children’s clothing department: $3,891
- Women’s clothing department: $2,533
Now assume that each department had an investment base of the following amounts:
- Children’s clothing department: $15,000
- Women’s clothing department: $65,000
To calculate the return on investment (ROI) for each department, divide the segment profit by the segment investment base. The ROI for each department is:
- Children’s clothing department: 25.9% ($3,891 / $15,000)
- Women’s clothing department: 3.9% ($2,533 / $65,000)
The children’s clothing department contributed the most to the financial position of this Apparel World location ($3,891 vs. $2,533). In addition, the children’s clothing department was able to better leverage every dollar invested into profit. Stated differently, for every dollar invested, the children’s clothing department was able to realize $0.259 of profit while the women’s clothing department realized only $0.039 of profit for every dollar invested.
It is also significant that the children’s clothing department requires a smaller dollar value of investment. This conserves store resources (financial capital) and helps store management prioritize and efficiently allocate future resources. By investing in the children’s clothing department, store management is able to invest a smaller dollar amount while achieving a higher rate of return (profitability) on that investment.
One of the criticisms of the ROI approach is that each segment evaluates potential investments only in relation to the individual segment’s ROI. This may cause the individual segment manager to select only projects or activities that improve the individual segment’s ROI and decline projects that improve the financial position of the overall company. Most often, segment managers are primarily evaluated based on the performance of the segment they manage with only a small portion, if any, of their evaluation based on overall corporate performance. This means that the bonuses of a segment manager are largely dependent on how the segment performs, or in other words, based on the decisions made by that segment manager. A manager may choose to forgo a project or activity because it will lower the segment’s ROI even though the project would benefit the entire company. ROI and the many implications of its use are explained further and demonstrated in Balanced Scorecard and Other Performance Measures.
The final investment center evaluation method, residual income (RI), structures the investment selection process to incentivize segment managers to select projects that benefit the entire company, rather than only the specific segment.
Companies want to be sure the investments they make are generating an acceptable return. Additonally, individual investors want to ensure they are receiving the highest financial return for the money they are investing.
This article published in the New York Times on best investments listed Microsoft as having one of the best investments since 1926 (based on a study by Hendrik Bessembinder). Based on stock market returns to investors, Microsoft ranked third, behind ExxonMobil and Apple. According to the article, “since 1986, it has had an annualized return of 25 percent.”
Other companies in the ranking included familiar company names such as General Electric (ranked #4), Walmart (ranked #10), McDonald’s (#31), and Coca-Cola (#15).
But does historical success ensure future success? General Electric is listed in the article as the 4th highest-ranking company for creating wealth for investors. Conduct internet research to find out the condition of General Electric today. What do you think the future holds for General Electric?
As the world-wide economy changes, General Electric seems to be struggling to evolve, and this issue potentially leaves them with an uncertain future.
Residual income (RI) establishes a minimum level that all investments must attain in order to be accepted by management. This minimum acceptable level is defined as a dollar value and is applicable to all departments or segments of the business. Residual income is calculated by taking the segment income less the product of the investment value and cost of capital percentage. The formula is:

As with the return on investment calculation, income can be defined as segment operating income (or loss) or segment profit (or loss). Some organizations may use different terms. In RI scenarios, the investment refers to a specific project the segment is considering. Investment, in RI calculations, should not be confused with the total investment base, which was used in the ROI calculation. Finally, the cost of capital, which is covered in Short-Term Decision-Making, refers to the rate at which the company raises (or earns) capital. Essentially, the cost of capital can be considered the same as the interest rate at which the company can borrow funds through a bank loan. By establishing a standard cost of capital rate used by all segments of the company, the company is establishing a minimum investment level that all investment opportunities must achieve. For example, assume a company can borrow funds from a local bank at an interest rate of 10%. The company, then, does not want a segment accepting an investment opportunity that earns anything less than 10%. Therefore, the company will establish a threshold—the cost of capital percentage—that will be used to screen potential investments. At the same time, under the residual income structure, managers of the individual segments (also called responsibility centers) will be incentivized to undertake investments that benefit not only the segment but also the entire company. Recall that the ROI of the children’s clothing department was 25.9% ($3,891 profit / $15,000 investment). Under an ROI analysis, the manager of the children’s clothing department would not accept an investment that earns less than 25.9% because the rate of return would be negatively impacted, even though the company may benefit. Under a residual income structure, managers would accept all investments with a positive value because the investment would exceeded the investment threshold established by the company.
Let’s look at an example. Recall that the children’s clothing department of Apparel World had an investment base of $15,000. Assuming the cost of capital (understood as the rate of a bank loan) to Apparel World is 10%. This is the rate that Apparel World will also set as the rate it expects all responsibility centers to earn. Therefore, in the example, the expected amount of residual value—the profit goal, in a sense—for the children’s clothing department is $1,500 ($15,000 investment base × 10% cost of capital). Management is pleased with the December performance of the children’s clothing department because it earned a profit of $3,891, well in excess of the $1,500 goal.
Now let’s examine how the manager of the children’s clothing department would evaluate a potential investment opportunity. Assume in December the manager had an opportunity to invest to upgrade the store by adding a supervised children’s play area for children to use while parents shopped. The manager believes this enhancement might increase sales because parents could take their time shopping, while knowing their children are safe and having fun. The upgrade would make the customer shopping experience more enjoyable for everyone.
The children’s play area requires an investment of $50,000 and the expected increase in income as a result of the children’s play area is $5,001. Because the Apparel World store has a cost of capital requirement of 10%, the manager would invest in the children’s play area because the residual income on this investment would be positive. To be precise, the residual income is $1. Using the residual income formula, the residual income is $5,001 – ($50,000 × 10%) = $1.
While this is an exaggerated and oversimplified example, it is intended to highlight the fact that, as long as resources (funds) are available to invest, a responsibility manager will (or should) accept projects that have a positive residual value. In this example, the children’s clothing department would be in a better financial position by undertaking this project than if they rejected this project. The department earned $3,891 of profit in December but would have earned, based on the estimates, $3,892 if the department added the children’s play area.
The benefit of a residual income approach is that all investments in all segments of the organization are evaluated using the same approach. Instead of having each segment select only investments that benefit only the segment, the residual income approach guides managers to select investments that benefit the entire organization.
Key Concepts and Summary
- A responsibility accounting structure helps management evaluate the financial performance of the segments in the organization.
- Responsibility centers are segments within a responsibility accounting structure.
- Five types of responsibility centers include cost centers, discretionary cost centers, revenue centers, profit centers, and investment centers.
- Cost centers are responsibility centers that focus only on expenses.
- Discretionary cost centers are responsibility centers that focus only on controllable expenses.
- Revenue centers are responsibility centers that focus on revenues.
- Profit centers are responsibility centers that focus on revenues and expenses.
- Investment centers are responsibility centers that consider the investments made by the responsibility center.
- Return on investment is a particular type of investment center structure that calculates a responsibility center’s profit percentage relative to the center’s investment.
- Residual income is a particular type of investment center structure that evaluates investments using a common cost of capital rate amongst all responsibility centers.
(Figure)Which of the following is not a type of responsibility center?
- concentrated cost center
- investment center
- profit center
- cost center
(Figure)A system that establishes financial accountability for operating segments within an organization is called ________.
- a financial statement
- an internal control system
- responsibility accounting
- centralization
C
(Figure)A responsibility center in which managers are held accountable for both revenues and expenses is called a ________.
- discretionary cost center
- revenue center
- cost center
- profit center
(Figure)A responsibility center structure that considers investments made by the operating segments by using a common cost of capital percentage is called ________.
- return on investment
- residual income
- a profit center
- a discretionary cost center
B
(Figure)An important goal of a responsibility accounting framework is to help ensure which of the following?
- decision-making is made by the top executives.
- investments made by each segment are minimized.
- identification of operating segments that should be closed.
- segment and company financial goals are congruent.
(Figure)Describe the concept of responsibility accounting.
(Figure)Describe the concept of a cost center and, using a specific organization, give an example of how this might be used to achieve the strategic goals of the organization.
Answers will vary. One example is the transportation division in a school system. The goal of the transportation division is to manage costs while maintaining safety in transporting students.
(Figure)Describe the concept of a profit center and, using a specific organization, give an example of how this might be used to achieve the strategic goals of the organization.
(Figure)Explain the benefits of a return on investment structure within an investment center framework. It may help to think of an example using an existing company.
Answers will vary. The benefits of an ROI structure include consideration for the segment’s investment and evaluation of management’s ability to generate profitability. In addition, this framework incentivizes management to undertake value-added investments. A disadvantage is that the segment may prioritize the segment over company financial goals.
(Figure)Explain the benefits of a residual income structure within an investment center framework. It may help to think of an example using an existing company.
(Figure)Assume you have been hired by Hilton Hotels and Resorts. As part of your new role in the accounting department, you have been tasked to set up a responsibility accounting structure for the company. As your first task, your supervisor has asked you to give an example of a cost center, profit center, and an investment center within the Hilton organization. Your supervisor is a little unsure of the difference between a profit center and investment center and would like you to explain the difference.
(Figure)Consider the national nonprofit organization the American Red Cross. Assume you are the regional director of the organization, and you just received the quarterly financial reports. Even though the organization is a nonprofit, assume it is set up as a profit center because it is helpful for the financial reports to show both donations and expenses by each region/location. One particular report shows there is one location in your region that is extremely over budget on nearly every expense item. From a management perspective, can you think of a reason(s) when going over budget might actually be a good thing? As the regional manager, how might you respond to the overages to help the particular location in the future?
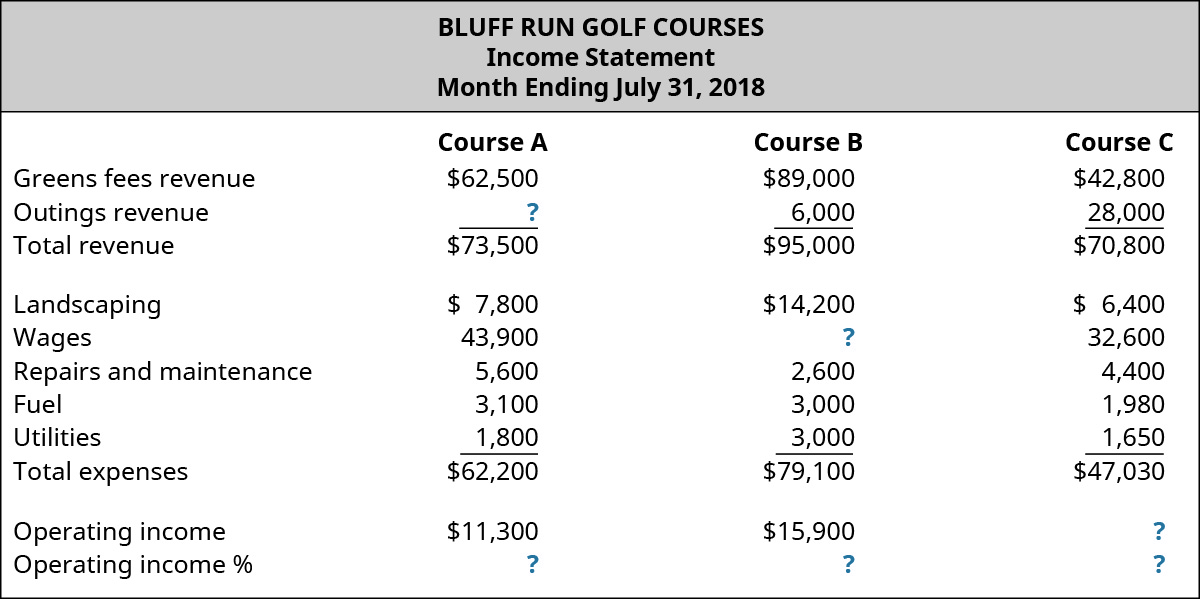
(Figure)The following information is from Bluff Run Golf Courses. The company runs three courses and the July income statement for each course is shown.
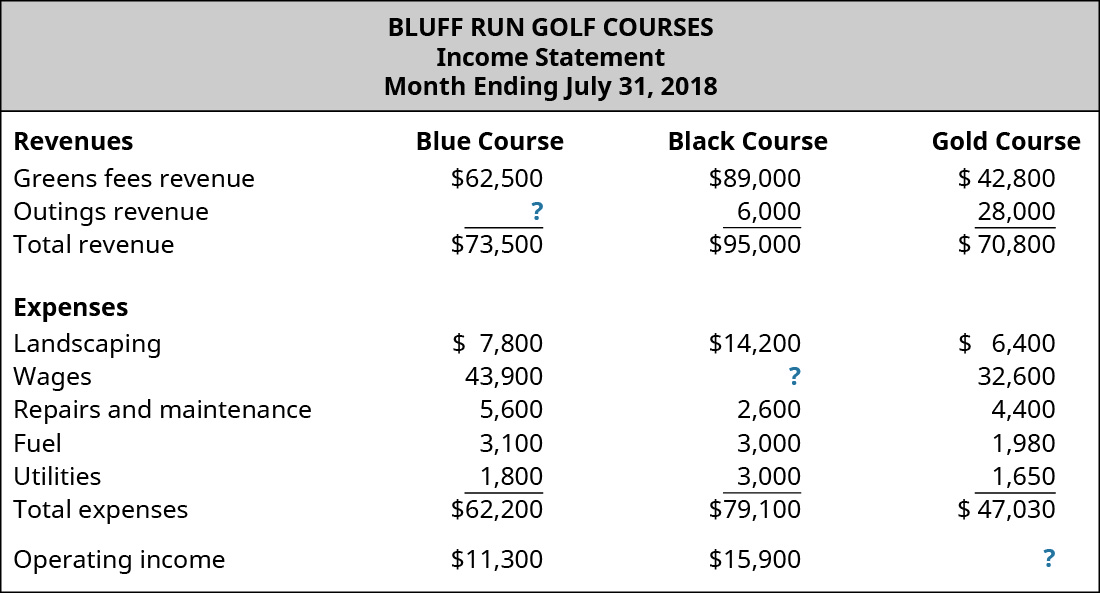
- Find the missing value for outings revenue, wages, and operating income.
- Comment on the financial performance of each course.
- Identify a limitation of analyzing the information provided.
You may want to consider using Microsoft Excel or another spreadsheet application for the numerical data. This information will be used in a subsequent question.
(Figure)The following information is from Dave’s Sporting Goods. Dave’s is a Midwest sporting goods store with three regional stores. The August income statement for all stores is shown.
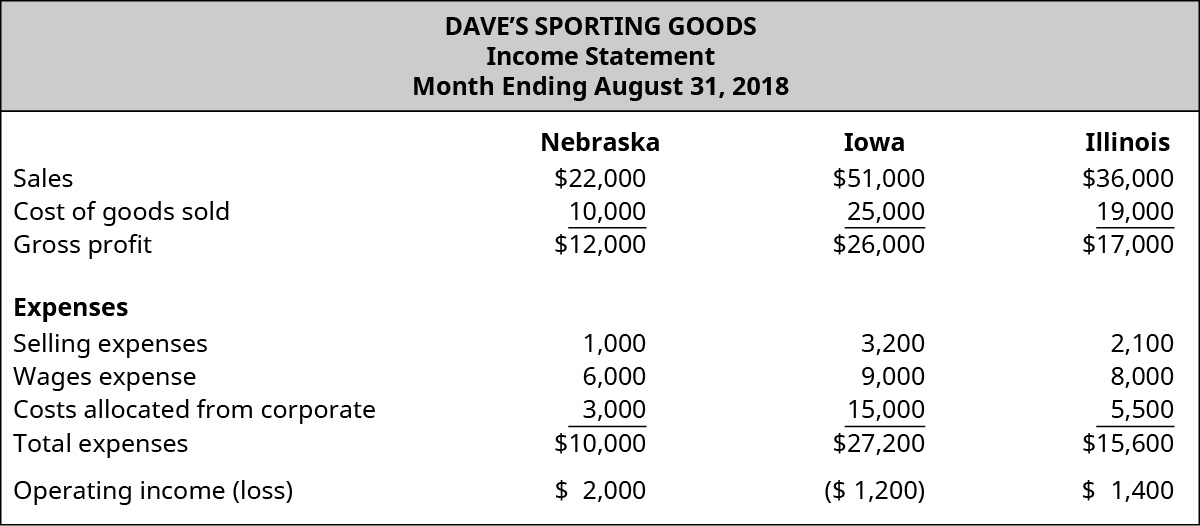
- Comment on the operating income results for each store.
- Now assume the costs allocated from corporate is an uncontrollable cost for each store. How does this change your assessment of each store?
(Figure)Assume you have been hired by Cabela’s Sporting Goods. As part of your new role in the accounting department, you have been tasked to set up a responsibility accounting structure for the company. As your first task, your supervisor has asked you to give an example of a cost center, profit center, and an investment center within the Cabela’s organization. Your supervisor is a little unsure of the difference between a profit center and investment center and would like you to explain the difference.
(Figure)Assume you are the regional manager for a hotel chain. You receive the quarterly financial reports and notice one particular hotel had drastically lower revenue and a corresponding high occupancy rate. Upon further investigation, you discover the manager for the hotel provided lodging for a neighboring town that was hit by a tornado. As the manager, how do you respond to this?
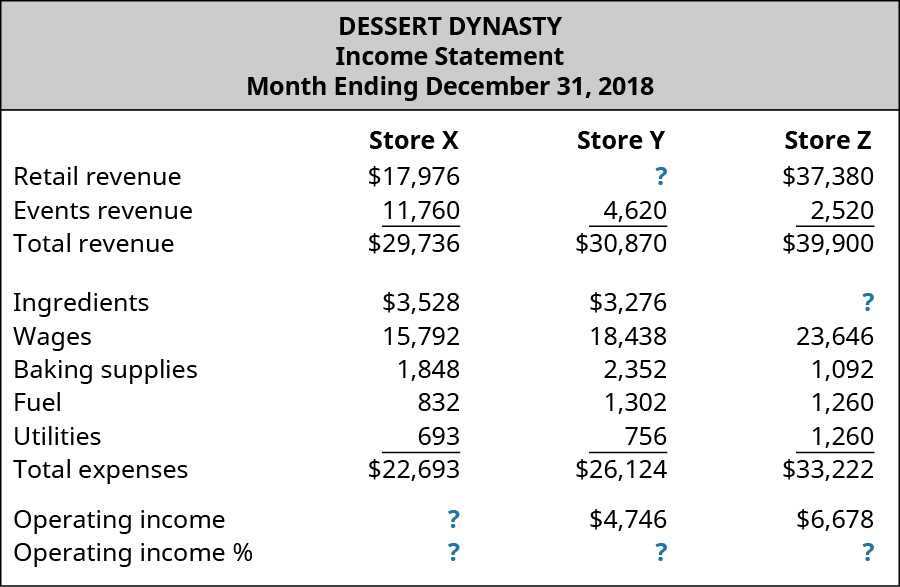
(Figure)The following information is from Dessert Dynasty. The company runs three stores and the December Income Statement for all stores is shown.
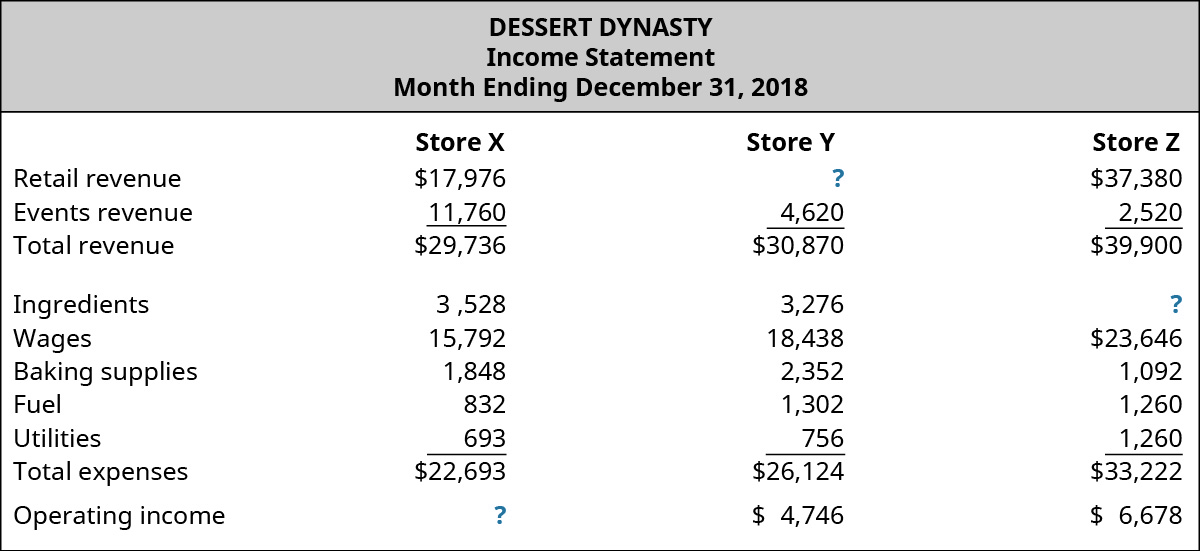
- Find the missing values for retail revenue, ingredients, and operating income.
- Comment on the financial performance of each store.
- Identify a limitation of analyzing the information provided.
You may want to consider using Microsoft Excel or another spreadsheet application for the numerical data. This information will be used in a subsequent question.
(Figure)The following information is from Good Read Books. Good Read is a regional book store with three regional stores. The May income statement for all stores is shown.
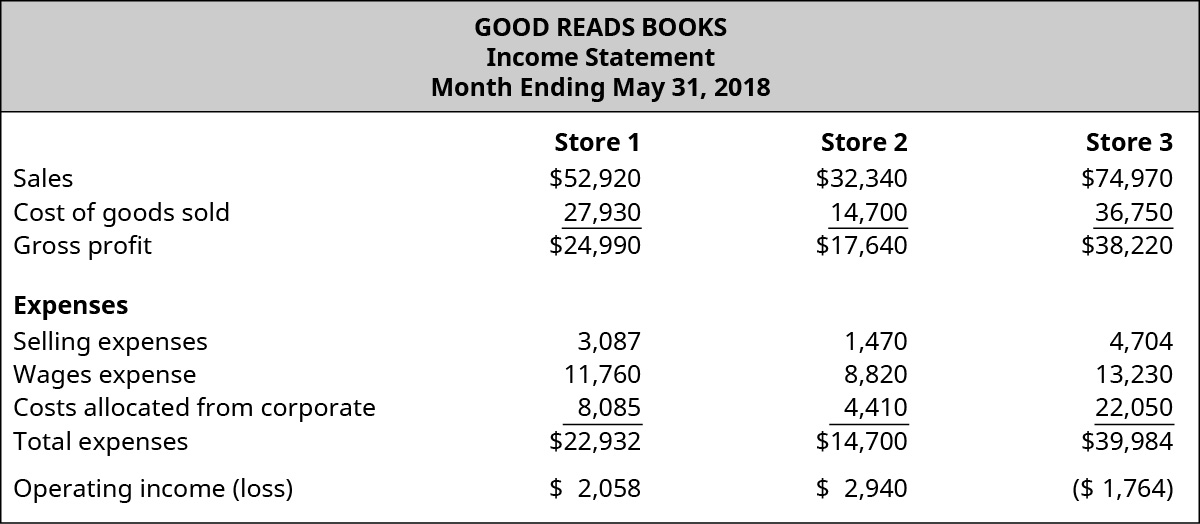
- Comment on the operating income results for each store.
- Now assume the costs allocated from corporate is an uncontrollable cost for each store. How does this change your assessment of each store?
(Figure)Use the following information to answer the questions that follow.
- Calculate the operating income percentage for each of the courses. Comment on how your analysis has changed for each course.
- Perform a vertical analysis for each course. Based on your analysis, what accounts would you want to investigate further? How might management utilize this information?
- Which method of analysis (using a dollar value or percentage) is most relevant and/or useful? Explain.
(Figure)Use Netflix’s 2017 annual report to answer the following questions.
- Using the revenue and contribution profit information, calculate the contribution profit (loss) percentage for each of the divisions. Comment on how your analysis has changed compared to your analysis of the dollar amounts for each division.
- Since companies typically do not publicly provide more than macro levels of asset values, let’s assume the following level of assets (investment):
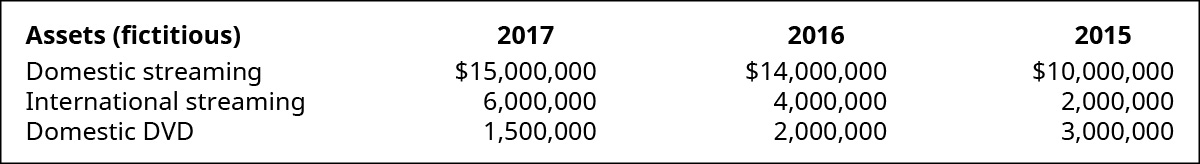
Calculate the return on investment (ROI) for each division. Comment on the results. - Assume that Netflix uses a cost of capital of 7%. Calculate the residual income (RI) for each of the divisions. Comment on the results.
(Figure)The income statement comparison for Forklift Material Handling shows the income statement for the current and prior year.
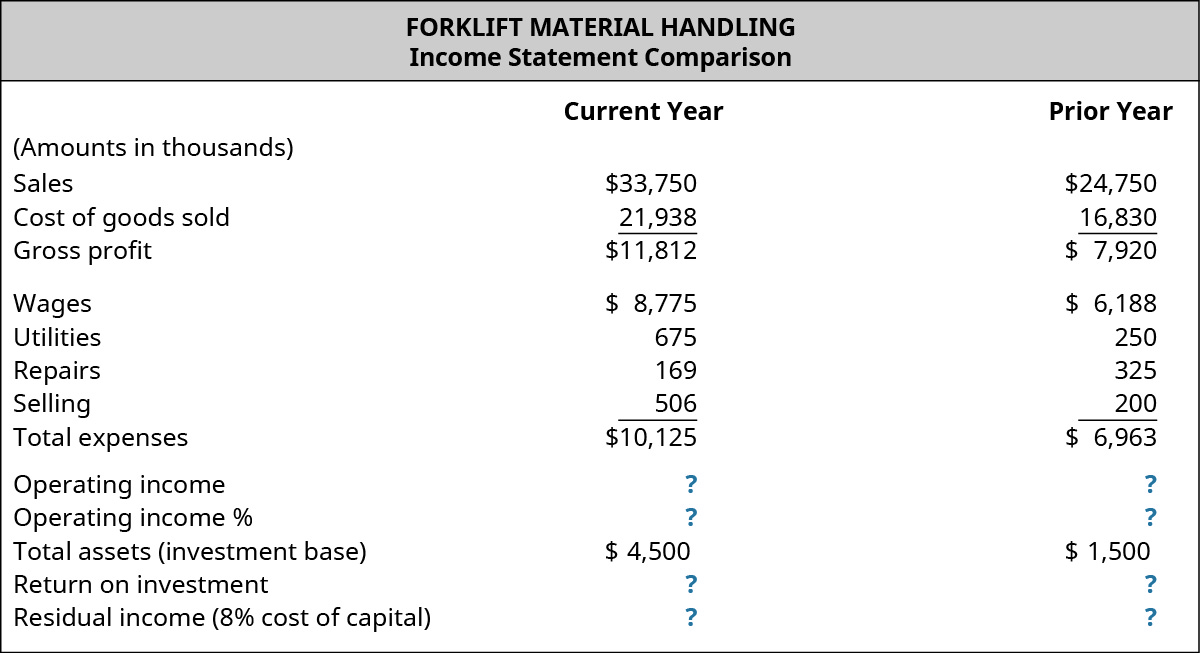
- Determine the operating income (loss) (dollars) for each year.
- Determine the operating income (percentage) for each year.
- The company made a strategic decision to invest in additional assets in the current year. These amounts are provided. Using the total assets amounts as the investment base, calculate the return on investment. Was the decision to invest additional assets in the company successful? Explain.
- Assuming an 8% cost of capital, calculate the residual income for each year. Explain how this compares to your findings in part C.
(Figure)Assume you are the leather department manager at the Famous Football Factory. The leather department is a cost center and you are reviewing the scrap costs for the previous year, shown here:
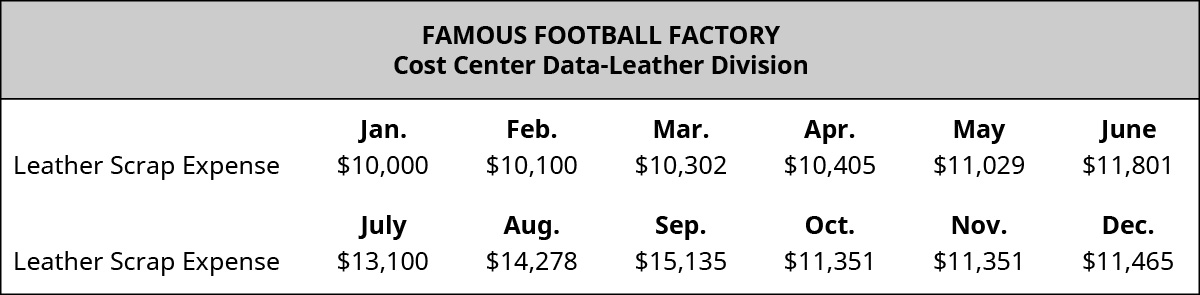
- Using Microsoft Excel or another spreadsheet application, create a line chart with markers showing the leather scrap expense. Describe your observations.
- Knowing that leather is susceptible to indoor temperature, you decide to talk with the maintenance manager and obtain the following information:
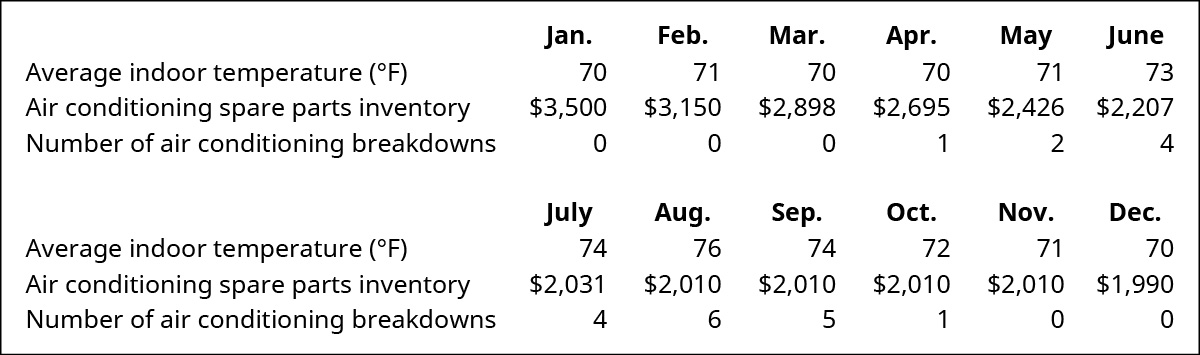
Using Microsoft Excel or another spreadsheet application, create individual line charts with markers showing the indoor temperature, spare parts inventory, and breakdowns. Describe your observations and actions you might consider.
(Figure)Use the following information to answer the questions that follow.
- Calculate the operating income percentage for each of the stores. Comment on how your analysis has changed for each store.
- Perform a vertical analysis for each store. Based on your analysis, what accounts would you want to investigate further? How might management utilize this information?
- Which method of analysis (using a dollar value or percentage) is most relevant and/or useful? Explain.
(Figure)Use Kellogg’s 2017 annual report to answer the following questions.
- Using the information for Kellogg, calculate the operating profit percentage for each of the divisions. Comment on how your analysis has changed compared to your analysis of the dollar amounts for each division.
- Using total assets as the investment, calculate the ROI for each division. In the total assets information you compile, you should ignore corporate and elimination entries amounts and you will also need to combine the U.S. divisions into a North American total. Comment on the results.
- Assume that Kellogg uses a cost of capital of 10%. Calculate the RI for each of the divisions (you will need to condense the U.S. divisions into a North American total). Comment on the results.
(Figure)The income statement comparison for Rush Delivery Company shows the income statement for the current and prior year.
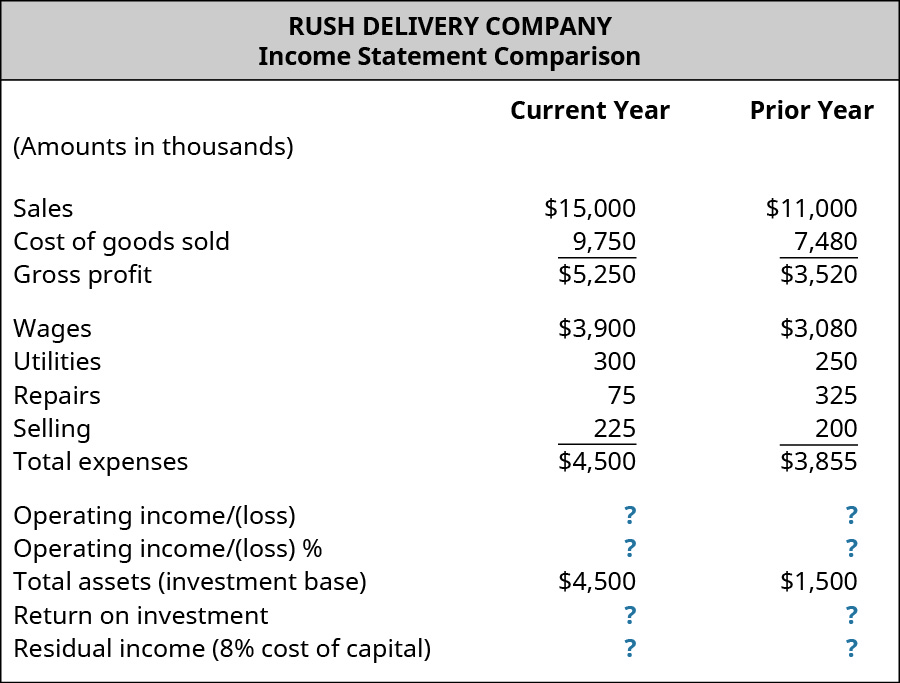
- Determine the operating income (loss) (dollars) for each year.
- Determine the operating income (percentage) for each year.
- The company made a strategic decision to invest in additional assets in the current year. These amounts are provided. Using the total assets amounts as the investment base, calculate the ROI. Was the decision to invest additional assets in the company successful? Explain.
- Assuming an 8% cost of capital, calculate the RI for each year. Explain how this compares to your findings in part C.
(Figure)Assume you are the manager for the semi-trucks division at the Speedy Delivery Company. The semi-truck division is a cost center and you are reviewing the driver overtime costs for the previous year, shown here:
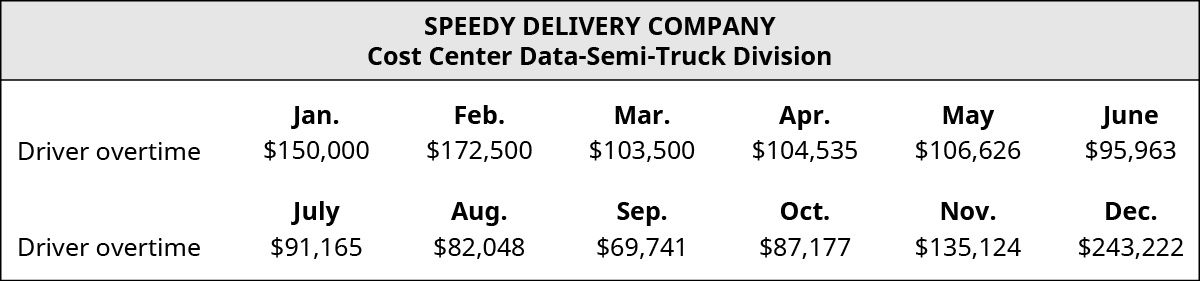
- Microsoft Excel or another spreadsheet application, create a line chart with markers showing the driver overtime expense. Describe your observations.
- Knowing that safety is important in your industry and weather plays a significant role in the safety of drivers, you decide to talk with the safety manager and obtained the following information:
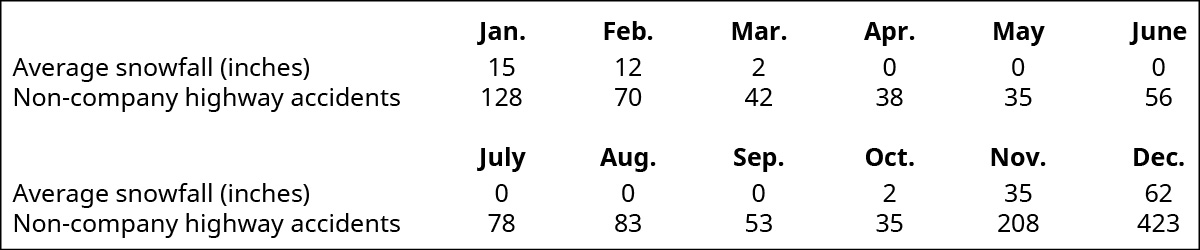
Using Microsoft Excel or another spreadsheet application, create individual line charts with markers showing the average snowfall and non-company highway accidents. Describe your observations and actions you might consider.
(Figure)Consider these two companies: Apple and ExxonMobil. Write a summary of your perception of each company’s financial position. Consider the levels of revenue, profitability, and any other financial measures you feel are relevant. After completing your summary, download Apple’s September 30, 2017 annual report (10-K) and download Exxon Mobil’s December 31, 2016 annual report (10-K) for more information.
Gather the following information for each company:
| Apple Data | |||
|---|---|---|---|
| Apple | 9/30/2017 | 9/24/2016 | 9/26/2015 |
| Net sales | |||
| Income before provision for income taxes | |||
| Net income | |||
| Exxon Mobile Data | |||
|---|---|---|---|
| Exxon | 2017 | 2016 | 2015 |
| Total revenues and other income | |||
| Income before income taxes | |||
| Net income attributable to ExxonMobil | |||
What observations do you have about the financial performance of each company? Calculate the net income % (also called profit margin %) of each company. What observations do you have? How do these results compare to your perception of these companies before reviewing the annual reports?
Footnotes
- 1 Sue Gleiter. “Hershey Company Goes Futuristic with 3-D Printed Chocolates.” PennLive. https://www.pennlive.com/food/index.ssf/2014/12/hersheys_3-d_chocolate.html
Glossary
- cost center
- organizational segment in which a manager is held responsible only for costs
- discretionary cost center
- organizational segment in which a manager is held responsible only for controllable costs when there is not a well-defined relationship between the center’s costs and its services or products
- investment center
- organizational segment in which a manager is accountable for profits (revenues minus expenses) and the invested capital used by the segment
- profit center
- organizational segment in which a manager is responsible for and evaluted on both revenues and costs
- residual income (RI)
- amount of income a given division (or project) is expected to earn in excess of a firm’s minimum return goal
- responsibility accounting
- method of encouraging goal congruence by setting and communicating the financial performance measures by which managers will be evaluated
- responsibility centers
- segments in which supervisors or managers have responsibility for the performance of the center and the authority to make decisions that affect the center
- return on investment (ROI)
- measure of the percentage of income generated by profits that were invested in capital assets
- revenue center
- part of an organization in which management is evaluated based on the ability to generate revenues; the manager’s primary control is only revenues
