
73 Evaluate an Operating Segment or a Project Using Return on Investment, Residual Income, and Economic Value Added
Patty Graybeal
There are three performance measures commonly used when a manager has control over investments, such as the buying and selling of inventory and equipment: return on investment, residual income, and economic value added. These measures use financial accounting data to evaluate how well a manager is meeting certain goals.
Introduction to Return on Investment, Residual Income, and Economic Value Added as Evaluative Tools
One of the primary goals of a company is to be profitable. There are many ways a company can use profits. For example, companies can retain profits for future use, they can distribute them to shareholders in the form of dividends, or they can use the profits to pay off debts. However, none of these options actually contributes to the growth of the company. In order to stay profitable, a company must continuously evolve. A fourth option for the use of company profits is to reinvest the profits into the company in order to help it grow. For example, a company can buy new assets such as equipment, buildings, or patents; finance research and development; acquire other companies; or implement a vigorous advertising campaign. There are many options that will help the company to grow and to continue to be profitable.
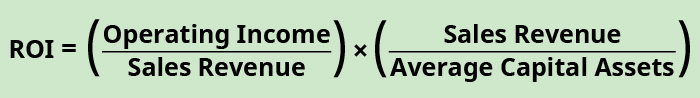
One way to measure how effective a company is at using its invested profits to be profitable is by measuring its return on investment (ROI), which shows the percentage of income generated by profits that were invested in capital assets. It is calculated using the following formula:

Capital assets are those tangible and intangible assets that have lives longer than one year; they are also called fixed assets. ROI in its basic form is useful; however, there are really two components of ROI: sales margin and asset turnover. This is known as the DuPont Model. It originated in the 1920s when the DuPont company implemented it for internal measurement purposes. The DuPont model can be expressed using this formula:

Sales margin indicates how much profit is generated by each dollar of sales and is computed as shown:

Asset turnover indicates the number of sales dollars produced by every dollar invested in capital assets—in other words, how efficiently the company is using its capital assets to generate sales. It is computed as:

Using ROI represented as Sales Margin × Asset Turnover, we can get another formula for ROI. Substituting the formulas for each of these individual ratios, ROI can be expressed as:
To visualize this ROI formula in another way, we can deconstruct it into its components, as in (Figure).
![Chart showing ROI at the top divided into two boxes: Sales Margin and Asset Turnover. The Sales Margin box flows down to a “Income divided by Sales Revenue” box, which flows down into a “Income divided by (Revenues minus Expenses)” box. The Asset Turnover box flows down into a “Sales Revenue divided by Average Capital Asset” box, which flows down into a “Sales Revenue divided by [(Capital Assets Beginning Year plus Capital Assets End of Year) divided by 2]” box.](https://spscc.pressbooks.pub/app/uploads/sites/63/2021/07/OSX_Acct_M12_03_DecompROI.jpg)
When sales margin and asset turnover are multiplied by each other, the sales components of each measure will cancel out, leaving
ROI captures the nuances of both elements. A good sales margin and a proper asset turnover are both needed for a successful operation. As an example, a jewelry store typically has a very low turnover but is profitable because of its high sales margin. A grocery store has a much lower sales margin but is successful because of high turnover. You can see it is important to understand each of these individual components of ROI.
Calculation and Interpretation of the Return on Investment
To put these concepts in context, consider a bakery called Scrumptious Sweets, Inc., that has three divisions and evaluates the managers of each of these decisions based on ROI. The following information is available for these divisions:
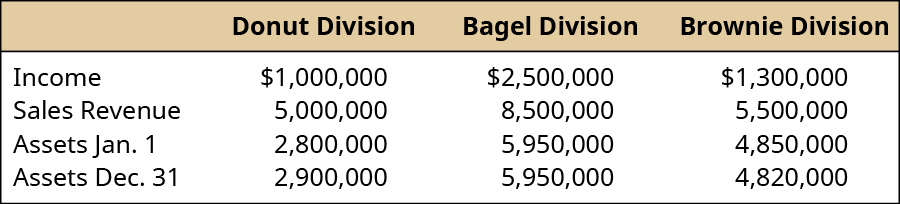
This information can be used to find the sales margin, asset turnover, and ROI for each division:
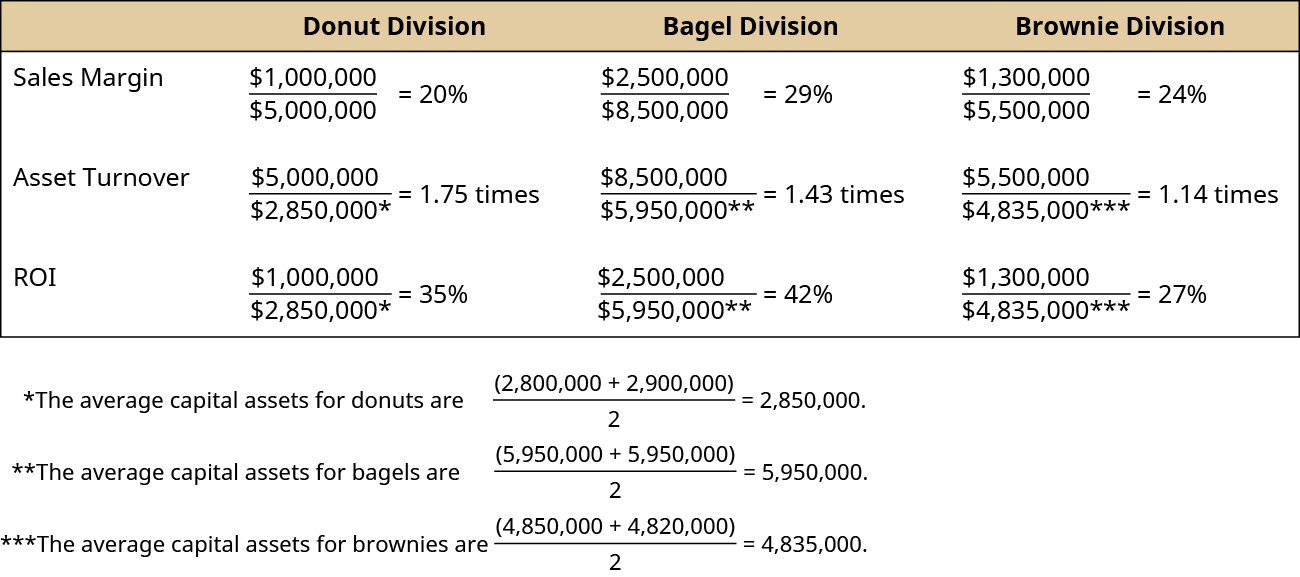
Alternatively, ROI could have been calculated by multiplying Sales Margin × Asset Turnover:

ROI measures the return in a percentage form rather than in absolute dollars, which is helpful when comparing projects, divisions, or departments of different sizes. How do we interpret the ROIs for Scrumptious Sweets? Suppose Scrumptious has set a target ROI for each division at 30% in order to share in the bonus pool. In this case, both the donut division and the bagel division would participate in the company bonus pool. What does the analysis regarding the brownie division show? By looking at the breakdown of ROI into its component parts of sales margin and asset turnover, it is apparent that the brownie division has a higher sales margin than the donut division, but it has a lower asset turnover than the other divisions, and this is affecting the brownie division’s ROI. This would provide direction for management of the brownie division to investigate why their asset turnover is significantly lower than the other two divisions. Again, ROI is useful if there is a benchmark against which to compare, but it cannot be judged as a stand-alone measure without that comparison.
Managers want a high ROI, so they strive to increase it. Looking at its components, there are certain decisions managers can make to increase their ROI. For example, the sales margin component can be increased by increasing income, which can be done by either increasing sales revenue or decreasing expenses. Sales revenue can be increased by increasing sales price per unit without losing volume, or by maintaining current sales price but increasing the volume of sales. Asset turnover can be increased by increasing sales revenue or decreasing the amount of capital assets. Capital assets can be decreased by selling off assets such as equipment.
For example, suppose the manager of the brownie division has been running a new advertising campaign and is estimating that his sales volume will increase by 5% over the next year due to this ad campaign. This increase in sales volume will lead to an increase in income of ?140,000. What does this do to his ROI? Division income will increase from ?1,300,000 to ?1,440,000, and the division average assets will stay the same, at ?4,835,000. This will lead to an ROI of 30%, which is the ROI that must be achieved to participate in the bonus pool.
Another factor to consider is the effect of depreciation on ROI. Assets are depreciated over time, and this will reduce the value of the capital assets. A reduction in the capital assets results in an increase in ROI. Looking at the bagel division, suppose the assets in that division depreciated ?500,000 from the beginning of the year to the end of the year and that no capital assets were sold and none were purchased. Look at the effect on ROI:
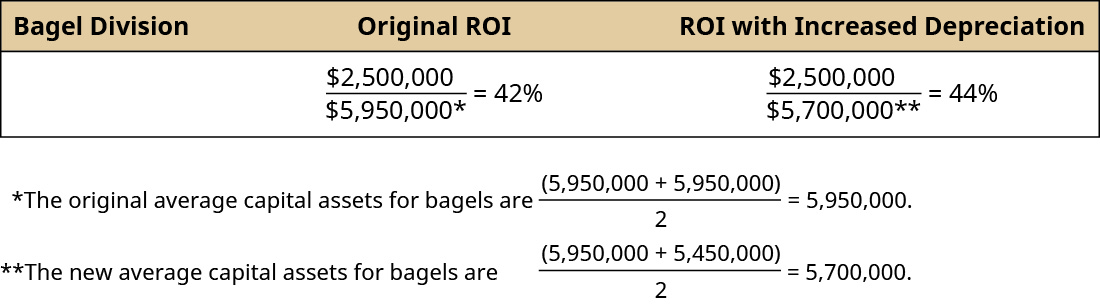
Notice that depreciation helped to improve the division’s ROI even though management made no new decisions. Some companies will calculate ROI based on historical cost, while others keep the calculation based on depreciated assets with the idea that the manager is efficiently using the assets as they age. However, if depreciated values are used in the calculation of ROI, as assets are replaced, the ROI will drop from the prior period.
One drawback to using ROI is the potential of decreased goal congruence. For example, assume that one of the goals of a corporation is to have ROI of at least 15% (the cost of capital) on all new projects. Suppose one of the divisions within this corporation currently has a ROI of 20%, and the manager is evaluating the production of a new product in his division. If analysis shows that the new project is predicted to have a ROI of 18%, would the manager move forward with the project? Top management would opt to accept the production of the new product. However, since the project would decrease the division’s current ROI, the division manager may reject the project to avoid decreasing his overall performance and possibly his overall compensation. The division manager is making an intentional choice based on his division’s ROI relative to corporate ROI.
In other situations, the use of ROI can unintentionally lead to improper decision-making. For example, look at the ROI for the following investment opportunities faced by a manager:
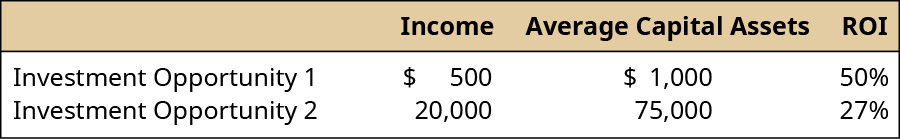
In this example, though investment opportunity 1 has a higher ROI, it does not generate any significant income. Therefore, it is important to look at ROI among other factors in order to make an informed decision.
Calculation and Interpretation of the Residual Income
Another performance measure is residual income (RI), which shows the amount of income a given division (or project) is expected to earn in excess of a firm’s minimum return goal. Every company sets a minimum required rate of return on projects and investments, representing the minimum return, usually in percentage form, that a project or investment must produce in order for the company to be willing to undertake it. This return is used as a basis for evaluating investments so that the firm may meet its targets and goals, and ensures that only profitable projects will be accepted. (You will learn the theory and mechanics behind establishing a minimum required rate of return in advanced accounting courses.)
Think about this concept in your own life. If you plan to invest in stocks, bonds, a work of art, precious stones, a graduate degree, or a business, you would want to know what your expected return would be before you made that investment. Most people shy away from investing time or money in things that do not provide a certain return, whether that return is money, happiness, or satisfaction. A company has to make similar decisions and decide where to spend its money and does not want to spend it in areas that will not return a minimum profit to the company and its shareholders. Companies will determine a minimum required rate of return as a basis against which to compare investment opportunities to aid in the decision of whether or not to accept a project. This minimum required rate of return is used to calculate residual income, which uses this formula:

Suppose the donut division of Scrumptious Sweets is considering acquiring new machinery to speed up the production of donuts and make the donuts more uniform in shape and size. The cost of the machine is ?1,500,000, and it is expected to generate a profit of ?250,000. Scrumptious has a corporate policy of a required minimum rate of return on projects of 18%. Based on residual income, should the donut division move forward on this project?
A project will be accepted as long as the RI is a positive number, because that implies the project is earning more than the minimum required by the company. Therefore, the manager of the donut division would not accept this project based on RI alone. Note that RI is measured in absolute dollars. This makes it almost impossible to compare firms of different sizes or projects of different sizes to one another. Both ROI and RI are useful, but as shown, both tools have drawbacks. Therefore, many companies will use a combination of ROI and RI (as well as other measures) to evaluate performance.
Calculation and Interpretation of Economic Value Added
Economic value added (EVA) is similar to RI but is a measure of shareholder wealth that is being created by a project, segment, or division. Companies want to maximize shareholder wealth, and to do that, they have to generate enough income to cover their cost of debt and their cost of equity, but also to have income available to shareholders. Just as in residual income, the goal is a positive EVA. A positive EVA indicates management has effectively used its capital assets to increase the value of the firm and thus the wealth of shareholders. EVA is computed as shown:

After-tax income is the income reduced by tax expenses. The weighted average cost of capital (WACC) is the cost that the company expects to pay on average to finance assets and growth using either debt or equity. WACC is based on the proportion of debt and equity held by a company and the costs of each of those. For example, if a company has a total of ?1,000,000 in debt and equity, consisting of ?400,000 in debt and ?600,000 in stock, then the proportion of the company’s capital structure that is debt is 40% (?400,000/?1,000,000), and the proportion that is equity is 60% (?600,000/?1,000,000).
What about the cost component for each? A company raises capital (money) in three primary ways: borrowing (debt), issuing stock (equity), or earning it (income). The cost of debt is the after-tax interest rate associated with borrowing money. The cost of equity is the rate associated with what the shareholders expect the corporation to earn in order for that shareholder to maintain ownership in the company. For example, shareholders of Apple stock may on average expect the company to earn a return of 10% per year; otherwise, they will sell their stock.
Sometimes the weighted average cost of capital and the required rate of return are the same for some companies, but often they will differ. Suppose Scrumptious Sweets, for example, has both debt capital and equity capital. (Figure) lists the cost of each type of capital as well as what proportion of the capital is made up of each of the two types. Notice that debt makes up 45% of the capital of Scrumptious Sweets and that the cost of debt is 8%. Equity makes up the other 55% of the capital structure of Scrumptious and the cost of equity is 9.8%. The weighted average cost of capital is the sum of each of the weighted cost of each type of capital. Thus, the weighted cost of debt is 0.08 × 0.45 = 0.036 or 3.6% and the weighted cost of equity is 0.098 × 0.55 = 0.054 or 5.4%. This results in a weighted average cost of capital of 3.6% plus 5.4%, or 9%.
| Scrumptious Sweets’ Weighted Average Cost of Capital | |||
|---|---|---|---|
Type of Capital |
A Cost of Capital |
B Proportion of Total Capital |
A × B Weighted Cost |
| Debt | 8% | 45% | 3.6% |
| Equity | 9.8% | 55% | 5.4% |
| Weighted Average Cost of Capital | 9% | ||
Reconsidering the new machine the donut division wants to buy, and using EVA to evaluate the project decision, would the decision change? Remember, the cost of the machine is ?1,500,000, and it is expected to generate a profit of ?250,000. Assume the tax rate for Scrumptious is 40%. To calculate EVA for the project, we need the following:
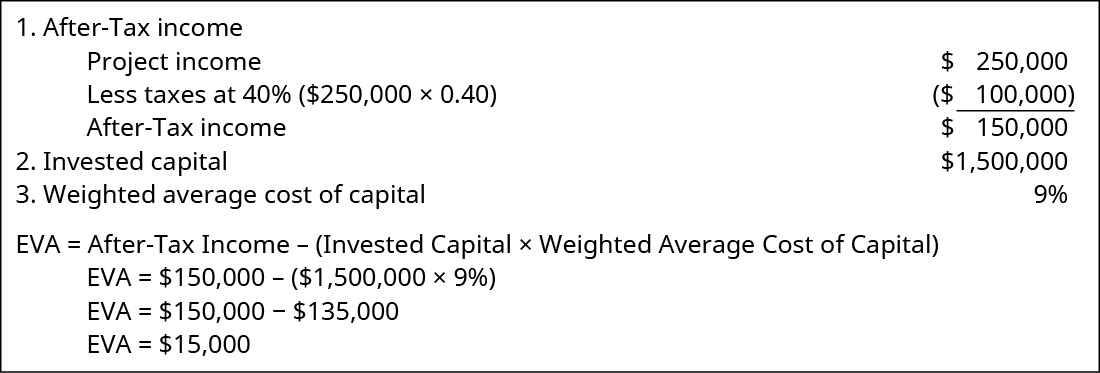
The positive EVA of ?15,000 indicates that the project is generating income for the shareholders and should be accepted.
As you can see, though RI and EVA look similar, they can lead to different decisions. This difference stems from two sources. First, RI is calculated based on management’s choice for the required rate of return, which can be determined from many different variables, whereas the weighted average cost of capital is based on the actual cost of debt and the estimated cost of equity, weighted by the actual percentages of both components. Second, when used to evaluate unit managers, RI often is based on pretax income, whereas EVA is based on after-tax income to the company itself. EVA and RI do not always lead to different decisions, but it is important that managers understand the components of both measures to ensure they make the best decision for the company.
Considerations in Using the Three Evaluative Tools
One of the most challenging aspects of using ROI, RI, and EVA lies in the determination of the variables used to calculate these measures. Income and invested capital are factors in the ROI, RI, and EVA performance models, and each can be defined in several ways. Invested capital can be defined as fixed assets, productive assets, or operating assets. Fixed assets typically include only tangible long-term assets. Productive assets typically include inventory plus the fixed assets. Operating assets include productive assets plus intangible assets, and current assets. One problem is determining which assets the manager can control with his or her decision-making authority. Each definition of invested capital will have a different impact on the performance measure, whether that measure is ROI, RI, or EVA. Deciding how to define invested capital is further complicated when combined with the additional decision of whether to use net book value (depreciated value) or gross book value (nondepreciated value) of long-lived assets. Net book value is the historical cost of an asset minus any accumulated depreciation, whereas gross book value is merely the historical cost of the asset. Obviously at the time of acquisition of an asset, these two numbers are the same, but over time, net book value will decrease for any given asset, while gross book value will stay the same for that asset. Using gross book value will result in a higher value for invested capital than using net book value. Remember, net book value will vary based on the depreciation method employed—straight line versus double declining balance, for example. Thus, gross book value removes the effect of choosing different depreciation methods. Despite this, most companies use net book value in the computation of ROI since net book value aligns with their financial reporting of capital assets on the balance sheet at their net value. Assets can also be measured at fair value, also known as market value. This is the value at which the assets could be sold. Fair value is only used in special cases of computing ROI such as in computing ROI for a real estate investment. The reason fair value is not typically used for ROI is that the fair or market value is rarely known or determinable with certainty and is often very subjective, whereas both gross and book value are readily known and determinable.
The second major component of these performance measures involves which income measure to use. First and foremost, no matter how a company measures income, the most important point is that the income the company uses as a measure should be controllable income if the performance model is to be a motivator and if the company uses responsibility accounting. Income, sometimes referred to as earnings, can be measured in many ways, and there are often common acronyms given for some of the these measures. Common ways to measure income are operating income (income before taxes); earnings before interest and taxes (EBIT); earnings before interest, taxes, and depreciation (EBITDA); net income (income after taxes); or return on funds employed (ROFE), which adds working capital to any of the other income measures. Companies must decide which income measure they want to use in their determination of these various performance metrics. They must consider how the metric is being used, who they are evaluating by that metric, and whether the income and capital asset chosen capture the decision-making authority of the individual or division whose performance is being evaluated.
The manager of the SkyHigh division of Superball Corp. is faced with a decision on whether or not to buy a new machine that will mix the ingredients used in the SkyHigh superball produced by the SkyHigh division. This ball bounces as high as a two-story building upon first bounce and is so popular that the SkyHigh division barely keeps up with demand. The manager is hoping the new machine will allow the balls to be produced more quickly and therefore increase the volume of production within the same time currently being used in production. The manager wants to evaluate the effect of the purchase of the machine on his compensation. He receives a base salary plus a 25% bonus of his salary if he meets certain income goals. The information he has available for the analysis is shown here:
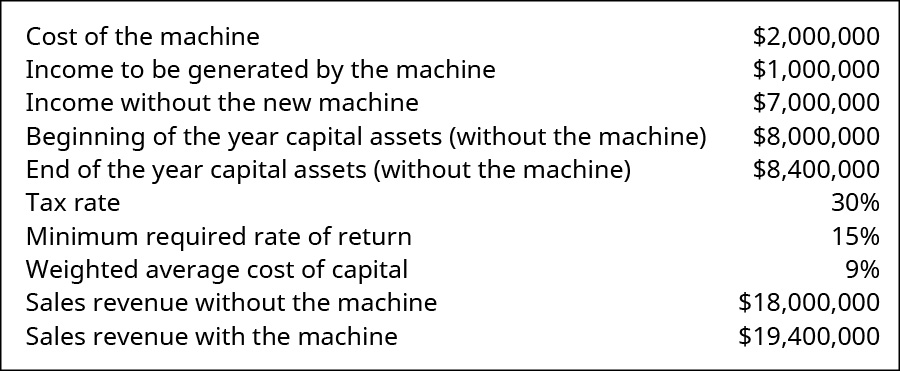
The manager is looking at several different measures to evaluate this decision. Answer the following questions:
- What is the sales margin without the new machine?
- What is the asset turnover without the new machine?
- What is ROI without the new machine?
- What is RI without the new machine?
- What is EVA without the new machine?
- What is the sales margin with the new machine?
- What is the asset turnover with the new machine?
- What is ROI with the new machine?
- What is RI with the new machine?
- What is EVA with the new machine?
- Should the manager buy the new machine? Why or why not?
- How would ROI be affected if the invested capital were measured at gross book value, and the gross book values of the beginning and end of the year assets without the new machine were ?11,000,000 and ?11,800,000, respectively?
Solution
- Income/Sales: ?7,000,000/?18,000,000 = 39%
- Sales/Average Assets: ?18,000,000/[(?12,000,000 + ?12,400,000)/2] = 1.48 times
- Income/Average Assets: ?7,000,000/[(?12,000,000 + ?12,400,000)/2] = 58%
Or #1 × #2: 39% × 1.48 = 58% - Income – (Invested Capital × Minimum Required Rate of Return)
?7,000,000 – (?12,200,000 × 0.15) = ?5,170,000 - After-Tax Income – (Invested Capital × Weighted Average Cost of Capital)
[?7,000,000 × (1 − 0.30)] × (?12,200,000 × 0.09) = ?3,802,000 - Income/Sales: ?8,000,000/?19,400,000 = 41%
- Sales/Average Assets: ?19,400,000/[(?12,000,000 + ?12,400,000)/2] = 1.59 times
- Income/Average Assets: ?8,000,000/[(?12,000,000 + ?12,400,000)/2] = 66%
Or #7 × #8: 41% × 1.59 = 66% - Income – (Invested Capital × Minimum Required Rate of Return)
?8,000,000 – (12,200,000 × 0.15) = ?6,170,000 - After-Tax Income – (Invested Capital × Weighted Average Cost of Capital)
[?8,000,000 × (1 – 0.30)] – (?12,200,000 × 0.09) = ?4,502,000 - The manager of the SkyHigh division of Superball Corp. should accept the project, as the project improves all of his performance measures.
- Income/Average Assets: ?8,000,000/[(?13,000,000 + ?13,800,000)/2] = 60% This shows that the choice used as the measure of assets can affect the analysis.
Key Concepts and Summary
- Three common performance measures based on financial numbers are return on investment, residual income, and economic value added.
- Return on investment measures how effectively a company generates income using its assets.
- ROI can be broken into two separate measures: sales margin and asset turnover.
- Residual income measures whether or not a project or a division is exceeding a minimum return that has been determined by management.
- Economic value added is used to measure how well a project or division is contributing to shareholder wealth.
- A big challenge with ROI, RI, and EVA is determining which value of income and assets to use in calculating these measures.
(Figure)Dixon Construction Materials has collected this information:
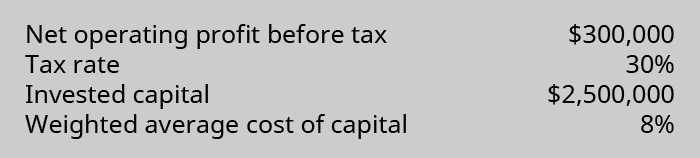
Based on this information, what is the EVA for the project?
- ?100,000
- ?10,000
- ?450,000
- (?110,000)
B
(Figure)The cost of equity is ________.
- the interest associated with debt
- the rate of return required by investors to incentivize them to invest in a company
- the weighted average cost of capital
- equal to the amount of asset turnover
(Figure)Which of the following measures the profitability of a division relative to the size of its investment in capital assets?
- residual income (RI)
- sales margin
- return on investment (ROI)
- economic value added (EVA)
C
(Figure)The capital structure of Ridley Enterprises is: Debt 40%, Equity 60%. The cost of debt is 13%, and the cost of equity is 16.5%. What is the weighted average cost of capital for Ridley Enterprises?
- 14.4%
- 15.1%
- 16.2%
- 13.8%
C
(Figure)What is EVA and why is it superior to other performance measures?
EVA is residual income adjusted for accounting distortions. Like residual income, it encourages managers to make appropriate levels of investment. In addition, it treats items such as research and development costs as having a long-term benefit to the company.
(Figure)What are the drawbacks to ROI? Give examples of each.
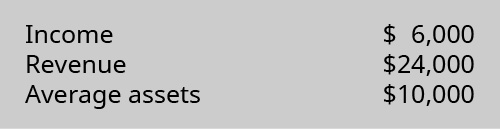
(Figure)During the current year, Sokowski Manufacturing earned income of ?350,000 from total sales of ?5,500,000 and average capital assets of ?12,000,000. What is the sales margin?
(Figure)During the current year, Sokowski Manufacturing earned income of ?350,000 from total sales of ?5,500,000 and average capital assets of ?12,000,000.
- Based on this information, calculate asset turnover.
- Using the sales margin from the previous exercise, what is the total ROI for the company during the current year?
(Figure)Assume Skyler Industries has debt of ?4,500,000 with a cost of capital of 7.5% and equity of ?5,500,000 with a cost of capital of 10.5%. What is Skyler’s weighted average cost of capital?
(Figure)Why do managers want a high ROI, and how would they strive to increase their ROI?
(Figure)During the current year, Plainfield Manufacturing earned income of ?845,000 from total sales of ?9,350,000 and average capital assets of ?13,500,000. What is the sales margin?
(Figure)During the current year, Plainfield Manufacturing earned income of ?845,000 from total sales of ?9,350,000 and average capital assets of ?13,500,000. Using the sales margin from the previous exercise, what is the total ROI for the company during the current year?
(Figure)Assume Plainfield Manufacturing has debt of ?6,500,000 with a cost of capital of 9.5% and equity of ?4,500,000 with a cost of capital of 11.5%. What is Tyler’s weighted average cost of capital?
(Figure)Though a high ROI is desired, what are some reasons that might lead to a low or decreased ROI?
(Figure)Macon Mills is a division of Bolin Products, Inc. During the most recent year, Macon had a net income of ?40 million. Included in the income was interest expense of ?2,800,000. The company’s tax rate was 40%. Total assets were ?470 million, current liabilities were ?104,000,000, and ?72,000,000 of the current liabilities are noninterest bearing. What are the invested capital and ROI for Macon?
(Figure)Jefferson Memorial Hospital is an investment center as a division of Hospitals United. During the past year, Jefferson reported an after-tax income of ?7 million. Total interest expense was ?3,200,000, and the hospital tax rate was 30%. Total assets totaled ?70 million, and non-interest-bearing current liabilities were ?22,800,000. The required rate of return established by Jefferson is equal to 18% of invested capital. What is the residual income of Jefferson Memorial Hospital?
(Figure)Evaluate the two departments for Moxie Products.
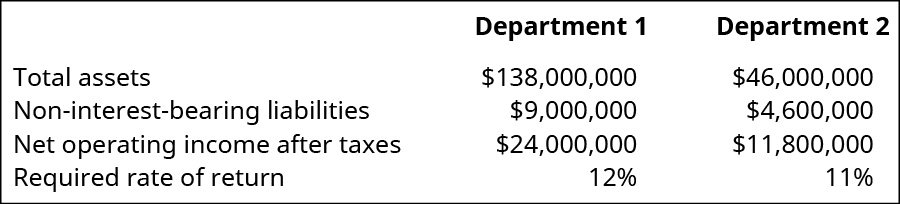
Compare the year’s performance of the two departments in terms of ROI and RI. Which department has created the most wealth for Moxie shareholders in the past year?
(Figure)Banyan Industries has two divisions, a tax rate of 30%, and a minimum rate of return of 20%. Division A has a weighted average cost of capital of 9.5% and is looking at a new project that will generate a profit of ?1,200,000 from a machine that costs ?4,000,000. Division B has a weighted average cost of capital of 9.5% and is looking at a new project that will generate a profit of ?1,350,000 from a machine that costs ?5,000,000.
- Calculate the EVA for each of Banyan’s divisions.
- Calculate the RI for each of Banyan’s division.
- If Banyan uses EVA to evaluate the projects, which division has the better project and by how much?
- If Banyan uses RI, which division has the better project and by how much?
- What are some of the reasons for the similarity or difference that you found in the use of EVA versus RI?
(Figure)Which of the performance measures—ROI, RI, or EVA—is best, and why? Explain your answer thoroughly.
Glossary
- after-tax income
- income reduced by tax expenses
- asset turnover
- measure of how efficiently a company is using its capital assets to generate revenues
- capital asset
- tangible or intangible asset that has a life longer than one year
- economic value added (EVA)
- measure of shareholder wealth that is being created by a project, segment, or division
- fixed asset
- tangible long-term asset
- invested capital
- fixed assets, productive assets, or operating assets
- minimum required rate of return
- minimum return, usually in a percentage form, that a project or investment must produce in order for the company to be willing to undertake it
- operating asset
- product asset plus intangible asset and current asset
- operating income
- income before considering interest and taxes
- productive asset
- fixed asset plus inventory
- residual income (RI)
- amount of income a given division (or project) is expected to earn in excess of a firm’s minimum return goal
- return on investment (ROI)
- measure of the percentage of income generated by profits that were invested in capital assets
- sales margin
- measure of how much profit is generated by each sales dollar
- weighted average cost of capital
- cost that the company expects to pay on average to finance assets and growth using either debt or equity
