
51 Describe How Companies Use Variance Analysis
Patty Graybeal
Companies use variance analysis in different ways. The starting point is the determination of standards against which to compare actual results. Many companies produce variance reports, and the management responsible for the variances must explain any variances outside of a certain range. Some companies only require that unfavorable variances be explained, while many companies require both favorable and unfavorable variances to be explained.
Requiring managers to determine what caused unfavorable variances forces them to identify potential problem areas or consider if the variance was a one-time occurrence. Requiring managers to explain favorable variances allows them to assess whether the favorable variance is sustainable. Knowing what caused the favorable variance allows management to plan for it in the future, depending on whether it was a one-time variance or it will be ongoing.
Another possibility is that management may have built the favorable variance into the standards. Management may overestimate the material price, labor rate, material quantity, or labor hours per unit, for example. This method of overestimation, sometimes called budget slack, is built into the standards so management can still look good even if costs are higher than planned. In either case, managers potentially can help other managers and the company overall by noticing particular problem areas or by sharing knowledge that can improve variances.
Often, management will manage “to the variances,” meaning they will make decisions that may not be advantageous to the company’s best interests over the long run, in order to meet the variance report threshold limits. This can occur when the standards are improperly established, causing significant differences between actual and standard numbers.
The proper use of variance analysis is a significant tool for an organization to reach its long-term goals. When its accounting system recognizes a variance, an organization needs to understand the significant influence of accounting not only in recording its financial results, but also in how reacting to that variance can shape management’s behavior toward reaching its goals.1 Many managers use variance analysis only to determine a short-term reaction, and do not analyze why the variance occurred from a long-term perspective. A more long-term analysis of variances allows an approach that “is responsibility accounting in which authority and accountability for tasks is delegated downward to those managers with the most influence and control over them.”2 It is important for managers to analyze the reported variances with more than just a short-term perspective.
Managers sometimes focus only on making numbers for the current period. For example, a manager might decide to make a manufacturing division’s results look profitable in the short term at the expense of reaching the organization’s long-term goals. A recognizable cost variance could be an increase in repair costs as a percentage of sales on an increasing basis. This variance could indicate that equipment is not operating efficiently and is increasing overall cost. However, the expense of implementing new, more efficient equipment might be higher than repairing the current equipment. In the short term, it might be more economical to repair the outdated equipment, but in the long term, purchasing more efficient equipment would help the organization reach its goal of eco-friendly manufacturing. If the system use for controlling costs is not aligned to reinforce management of the organization with a long-term perspective, “the manager has no organizational incentive to be concerned with important issues unrelated to anything but the immediate costs”3 related to the variance. A manager needs to be cognizant of his or her organization’s goals when making decisions based on variance analysis.
Management can use standard costs to prepare the budget for the upcoming period, using the past information to possibly make changes to production elements. Standard costs are a measurement tool and can thus be used to evaluate performance. As you’ve learned, management may manage “to the variances” and can manipulate results to meet expectations. To reduce this possibility, performance should be measured on multiple outcomes, not simply on standard cost variances.
As shown in (Figure), standard costs have pros and cons to consider when using them in the decision-making and evaluation processes.
| Standard Costs | |
|---|---|
| Pros | Cons |
|
|
Standard costing provides many benefits and challenges, and a thorough analysis of each variance and the possible unfavorable or favorable outcomes is required to set future expectations and adjust current production goals.
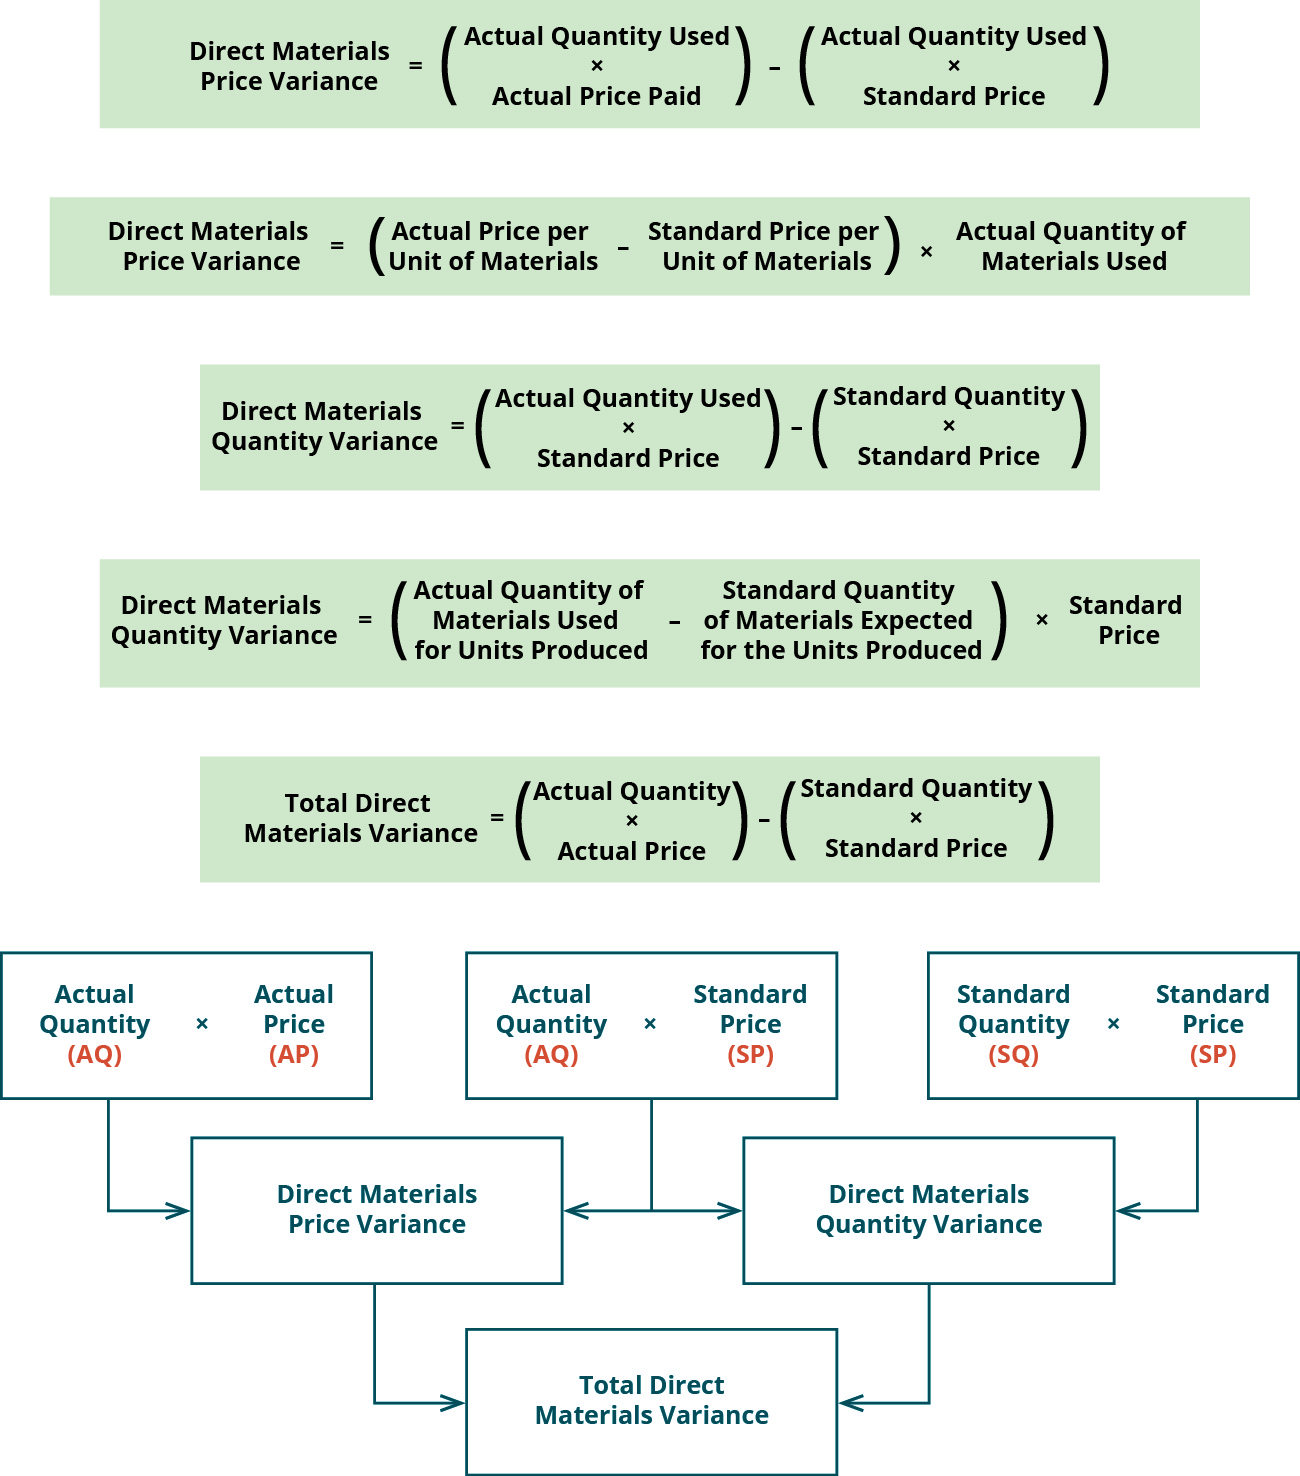
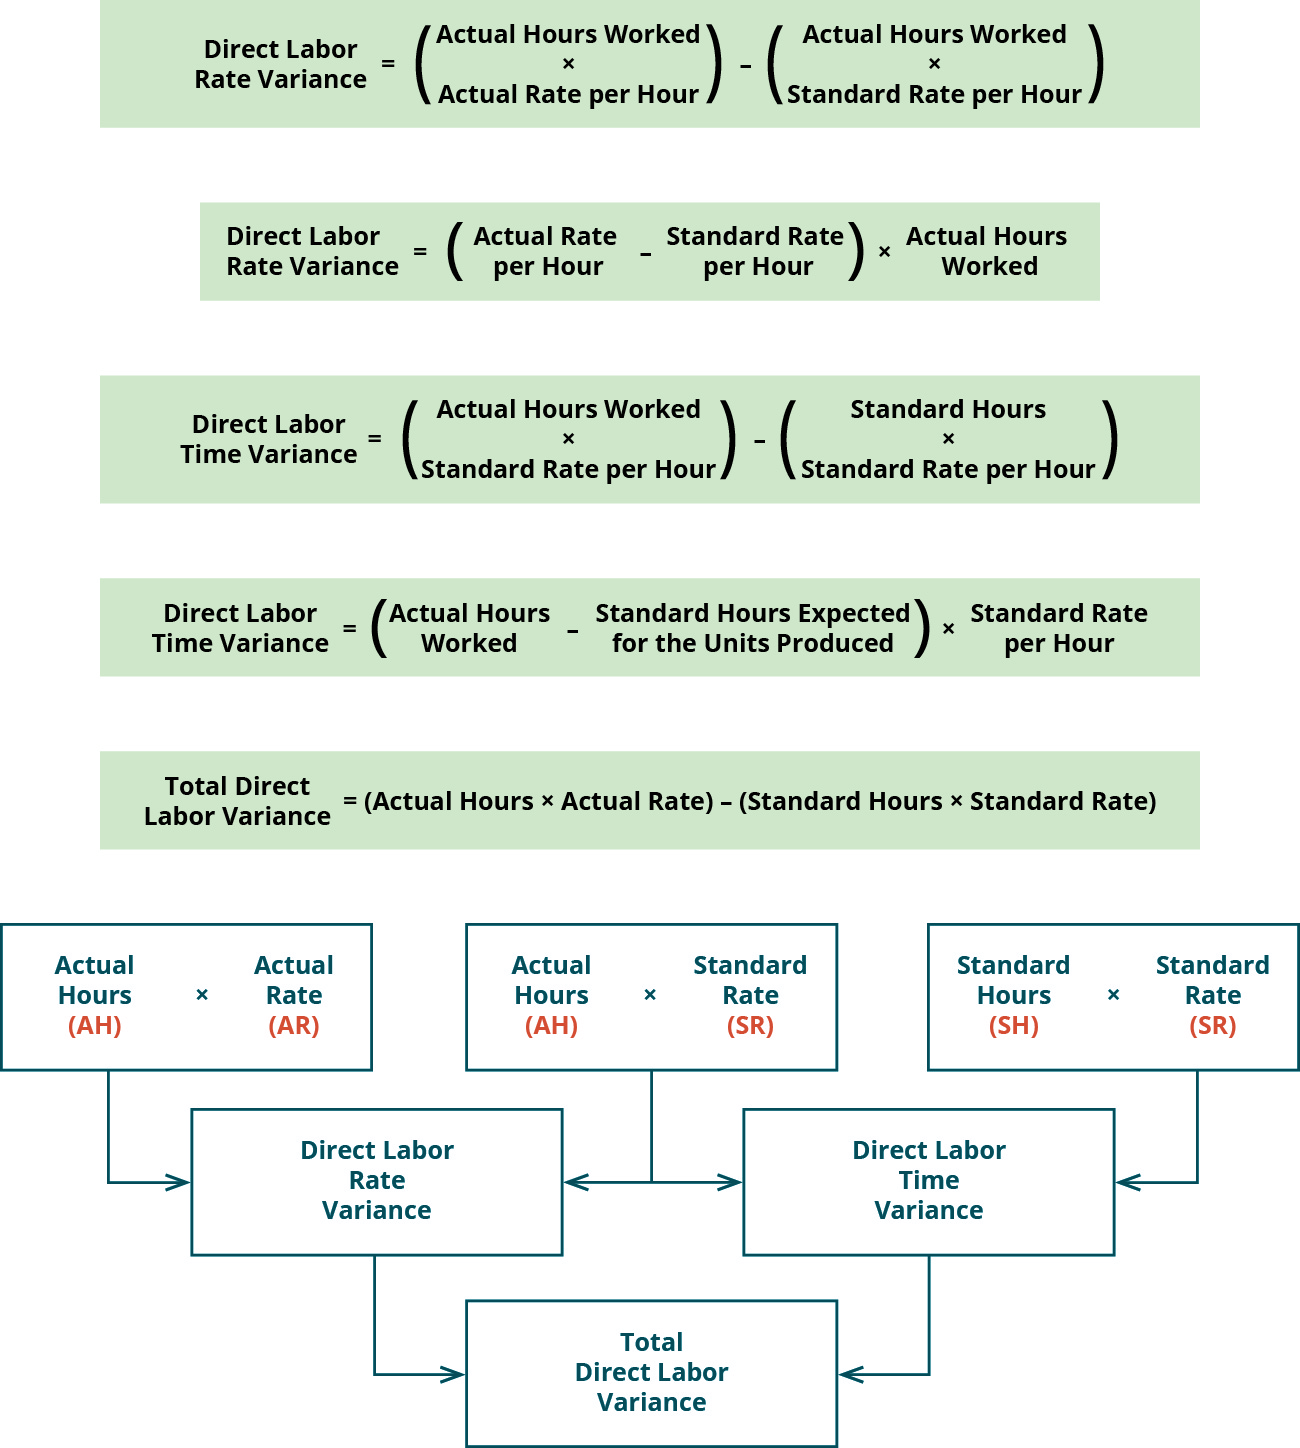
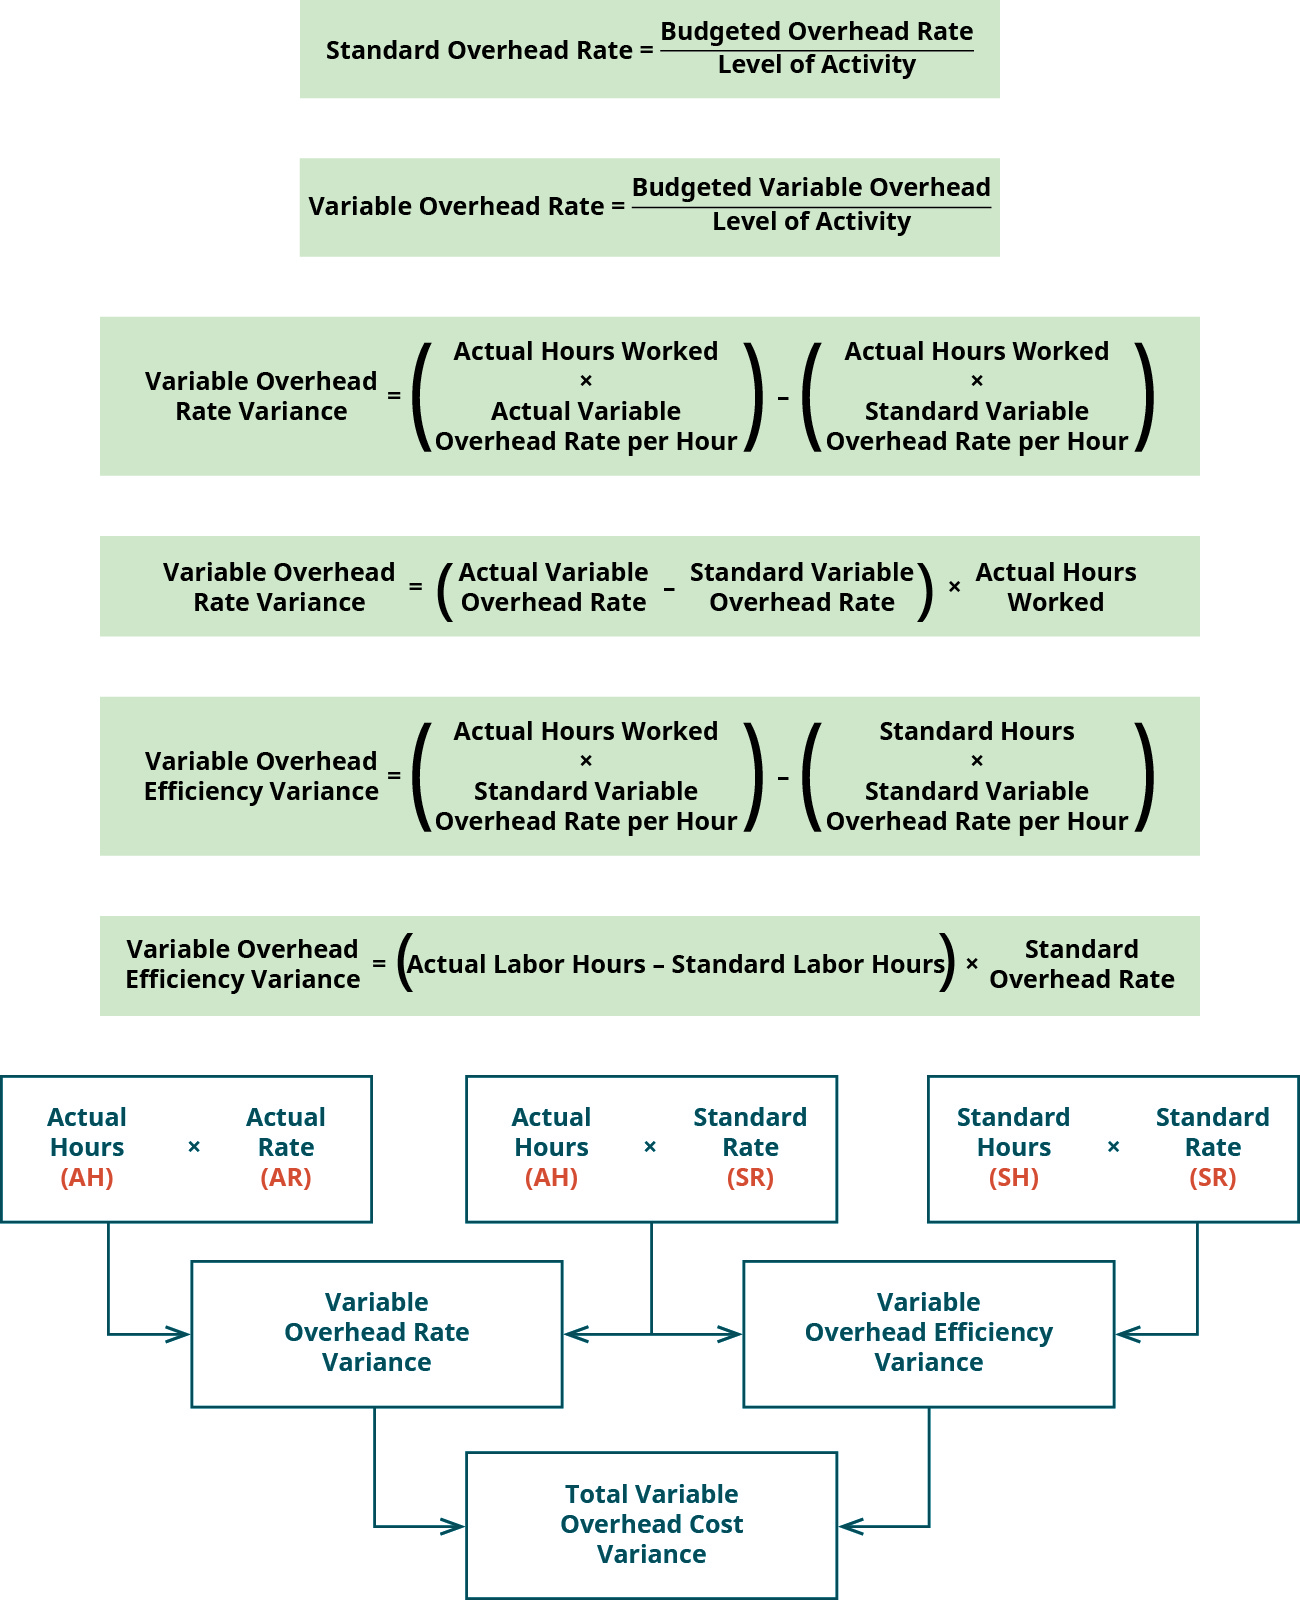
The following is a summary of all direct materials variances ((Figure)), direct labor variances ((Figure)), and overhead variances ((Figure)) presented as both formulas and tree diagrams. Note that for some of the formulas, there are two presentations of the same formula, for example, there are two presentations of the direct materials price variance. While both arrive at the same answer, students usually prefer one formula structure over the other.
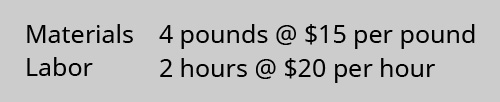
Barley, Inc., produces a product and has the following as standard costs per unit for materials and labor:
For the month of October, the following information was gathered related to production:
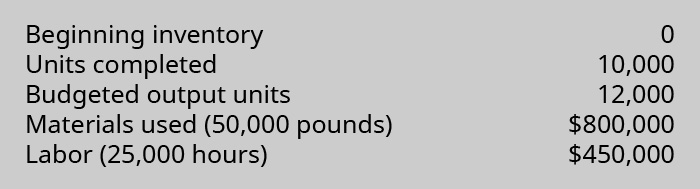
Compute:
- The materials price and quantity variances
- The labor rate and efficiency variances
Provide possible explanations for each variance.
Solution
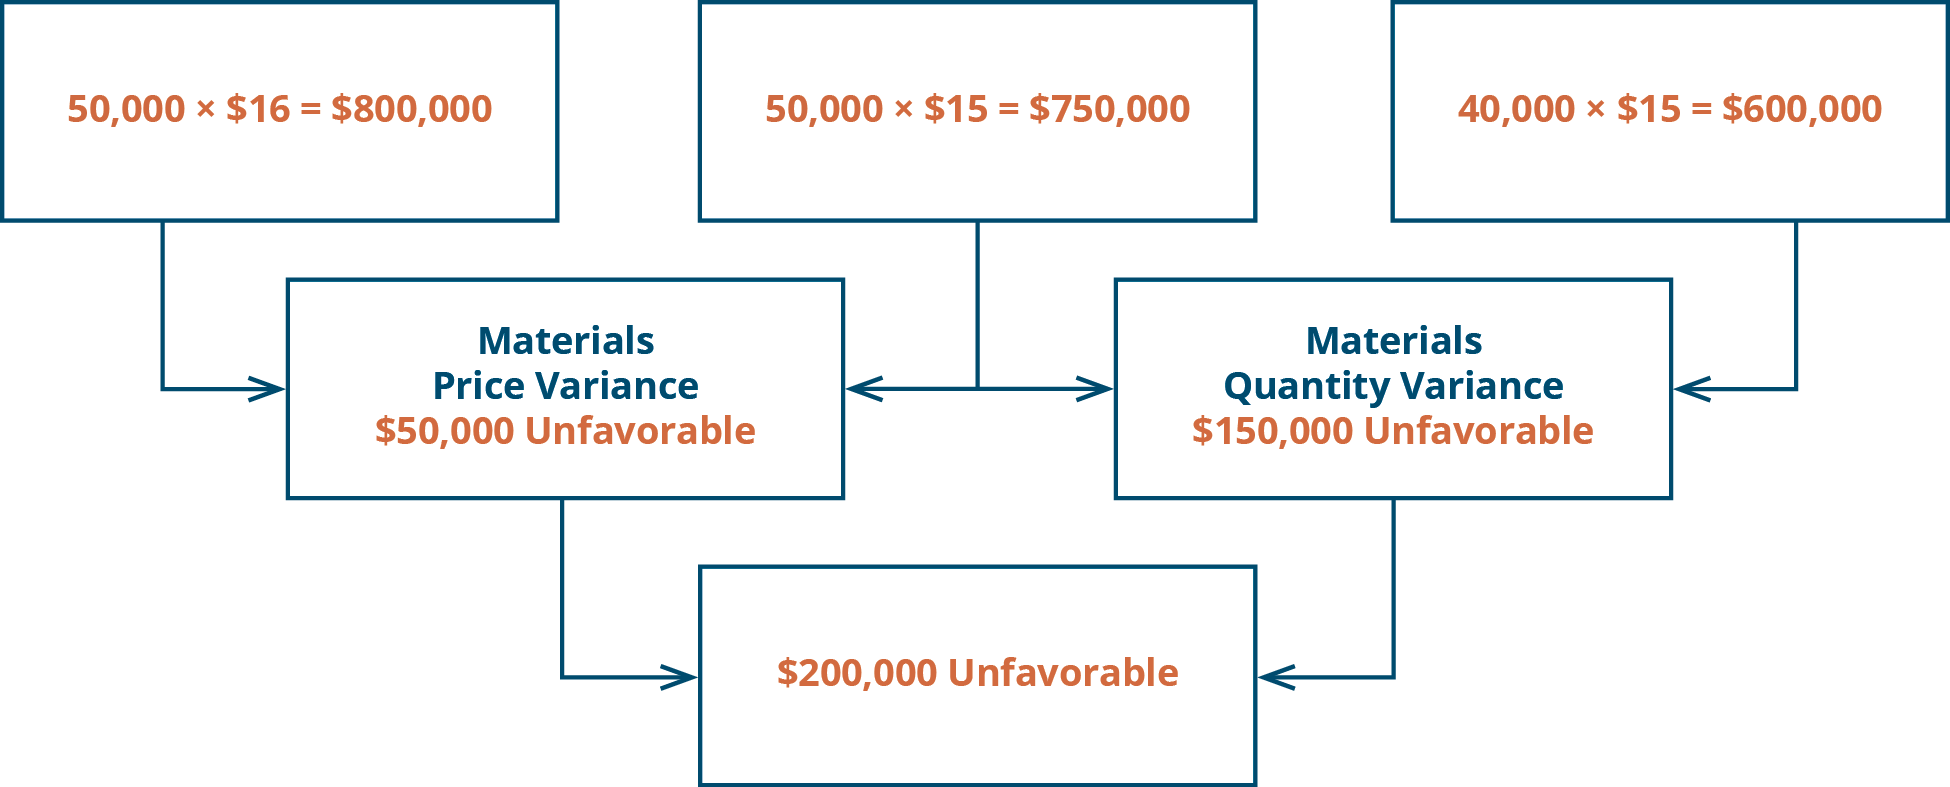
A.
Materials price variance:
$50,000 unfavorable = ($16* – $15) × 50,000 lb.
*$800,000/50,000
An unfavorable materials price variance occurred because the actual cost of materials was greater than the expected or standard cost. This could occur if a higher-quality material was purchased or the suppliers raised their prices.
Materials quantity variance:
$150,000 unfavorable = (50,000 lb. – 40,000* lb.) × $15 per lb.
*4 lb. × 10,000 units
An unfavorable materials quantity variance occurred because the pounds of materials used were greater than the pounds expected to be used. This could occur if there were inefficiencies in production or the quality of the materials was such that more needed to be used to meet safety or other standards.
Materials inputs:
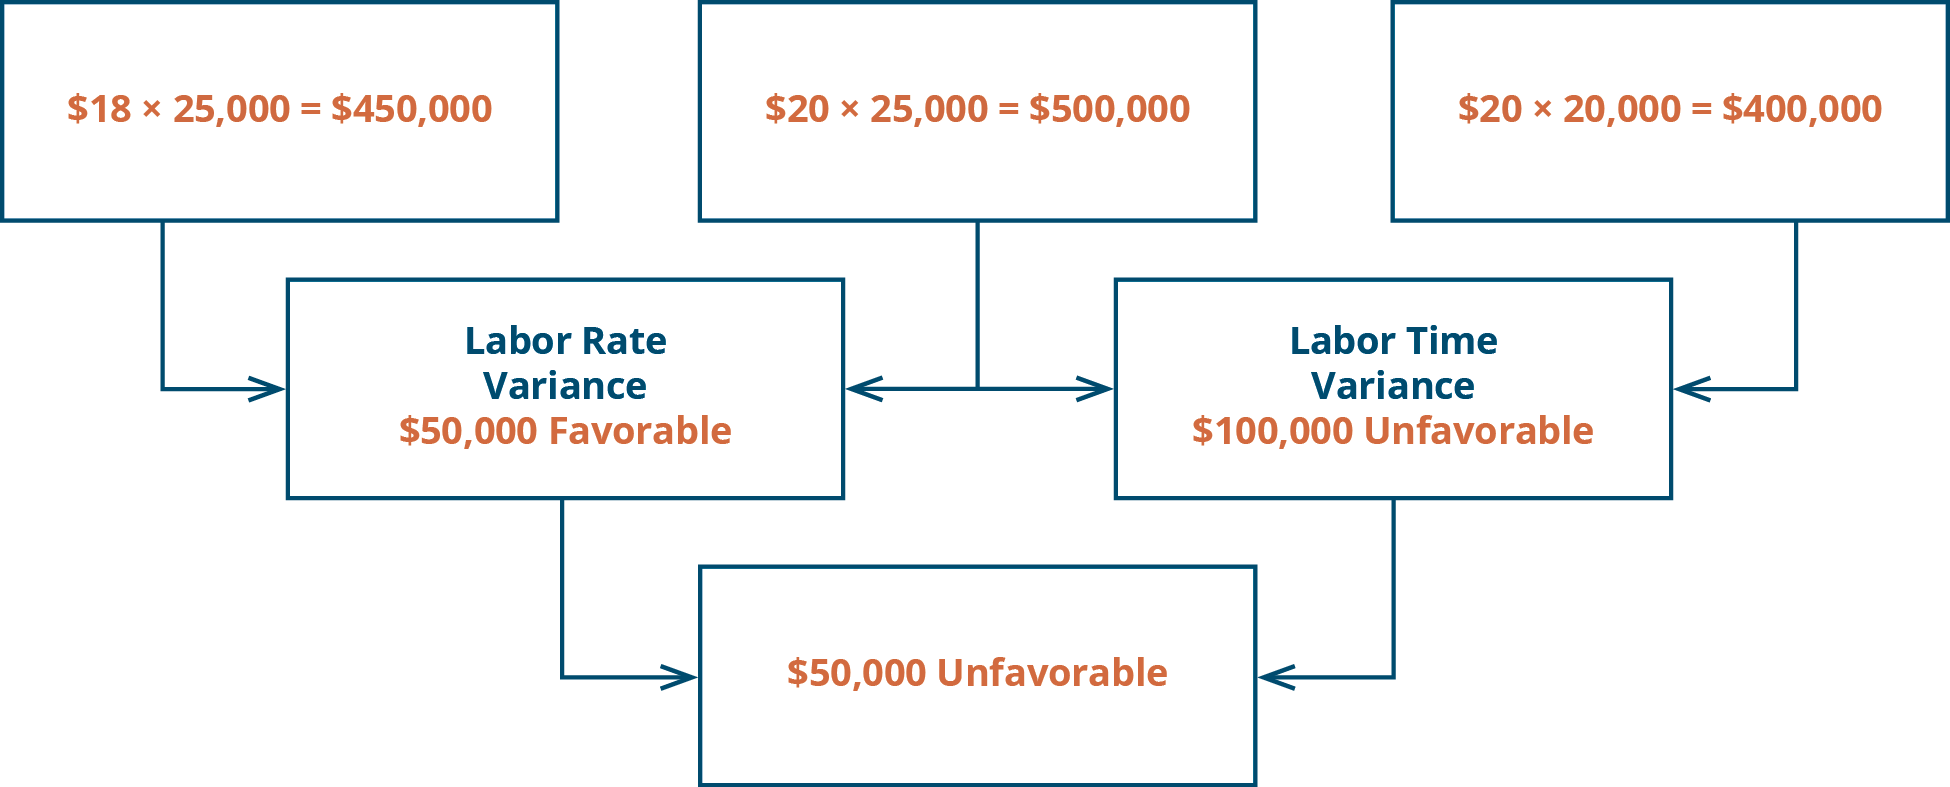
B.
Labor rate variance:
$50,000 favorable = ($18* per hour – $20 per hour) × 25,000 hours
*$450,000/25,000
A favorable labor rate variance occurred because the rate paid per hour was less than the rate expected to be paid (standard) per hour. This could occur because the company was able to hire workers at a lower rate, because of negotiated union contracts, or because of a poor labor rate estimate used in creating the standard.
Labor quantity variance:
$100,000 unfavorable = (25,000 hours – 20,000* hours) × $20 per hour
*2 hours × 10,000 units
An unfavorable labor quantity variance occurred because the actual hours worked to make the 10,000 units were greater than the expected hours to make that many units. This could occur because of inefficiencies of the workers, defects and errors that caused additional time reworking items, or the use of new workers who were less efficient.
Labor inputs:
The manager of a plant has called operations, purchasing, and personnel into her office to discuss the results of the last month. She notes that there was more than normal scrap, and employees worked more hours than expected. She is looking for an explanation for these results. What system might she have used to determine these material and labor issues? Why might these variances have occurred? What should she do about it for future periods?
See this article on the four major advantages of standard costing to learn more.
Key Concepts and Summary
- The key to analyzing variances is to determine why the variance occurred.
- If a company cannot determine why there is a variance, it will not know if the variance is indicative of a problem or not.
- All firms—manufacturing, retail, and service—use standards and variances.
(Figure)Which of the following is a possible cause of an unfavorable material price variance?
- purchasing too much material
- purchasing higher-quality material
- hiring substandard workers
- buying substandard material
(Figure)Which of the following is a possible cause of an unfavorable material quantity variance?
- purchasing substandard material
- hiring higher-quality workers
- paying more than should have for workers
- purchasing too much material
A
(Figure)Which of the following is a possible cause of an unfavorable labor efficiency variance?
- hiring substandard workers
- making too many units
- buying higher-quality material
- paying too much for workers
(Figure)Which of the following is a possible cause of an unfavorable labor rate variance?
- hiring too many workers
- hiring higher-quality workers at a higher wage
- making too many units
- purchasing too much material
B
(Figure)What causes a favorable variance?
It is caused by paying or using less than the standard amount.
(Figure)What causes an unfavorable variance?
(Figure)When might a favorable variance not be a good outcome?
It may not be a good outcome when buying substandard material or hiring substandard employees.
(Figure)When might an unfavorable variance be a good outcome?
(Figure)Identify several causes of a favorable material price variance.
Causes may include substandard material, quantity discount, negotiated better price, quantity discount, or price drop.
(Figure)Identify several causes of an unfavorable material price variance.
(Figure)Identify several causes of a favorable material quantity variance.
Causes may include higher-quality material, better-qualified employees, or a change in manufacturing process.
(Figure)Identify several causes of an unfavorable material quantity.
(Figure)Identify several causes of a favorable labor rate variance.
Causes may include less-qualified employees or a change in quality level of employees due to a change in process.
(Figure)Identify several causes of an unfavorable labor rate variance.
(Figure)Identify several causes of a favorable labor efficiency variance.
Causes may include better material, higher-quality employees, or a change in process.
(Figure)Identify several causes of an unfavorable labor efficiency variance.
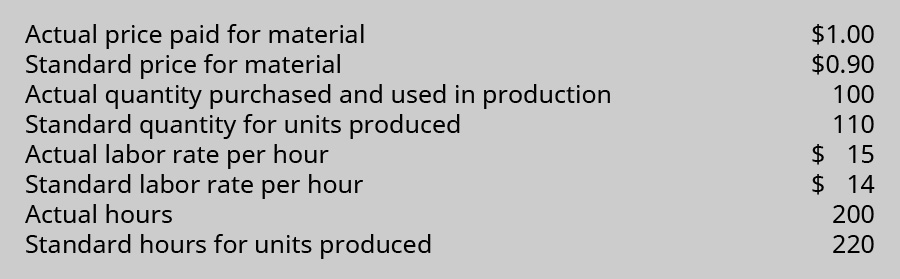
(Figure)Acme Inc. has the following information available:

- Compute the material price and quantity, and the labor rate and efficiency variances.
- Describe the possible causes for this combination of favorable and unfavorable variances.
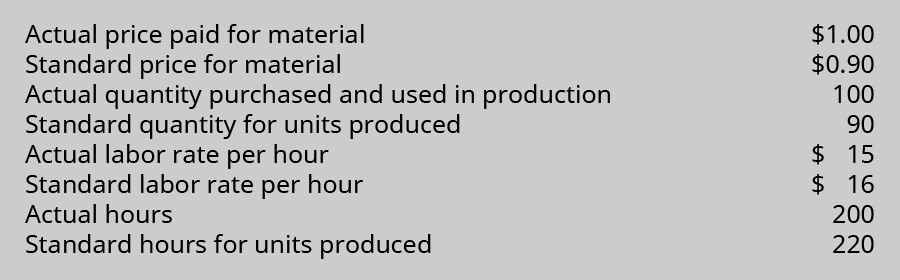
(Figure)Acme Inc. has the following information available:
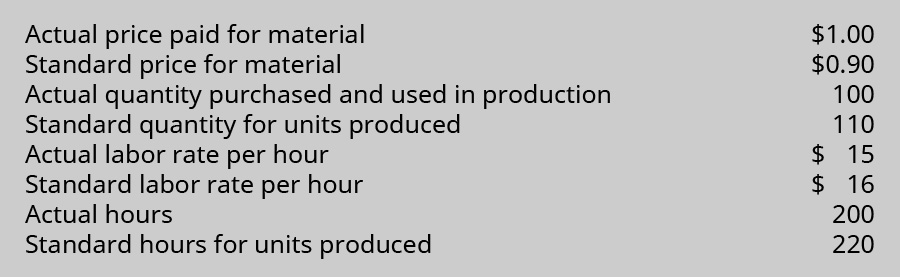
- Compute the material price and quantity, and the labor rate and efficiency variances.
- Describe the possible causes for this combination of favorable and unfavorable variances.
(Figure)Acme Inc. has the following information available:
- Compute the material price and quantity, and the labor rate and efficiency variances.
- Describe the possible causes for this combination of favorable and unfavorable variances.
(Figure)Acme Inc. has the following information available:

- Compute the material price and quantity, and the labor rate and efficiency variances.
- Describe the possible causes for this combination of favorable and unfavorable variances.
(Figure)Acme Inc. has the following information available:

- Compute the material price and quantity, and the labor rate and efficiency variances.
- Describe the possible causes for this combination of favorable and unfavorable variances.
(Figure)Acme Inc. has the following information available:
- Compute the material price and quantity, and the labor rate and efficiency variances.
- Describe the possible causes for this combination of favorable and unfavorable variances.
(Figure)Recompute the variances from the second Acme Inc. exercise using $0.0725 as the standard cost of the material and $14 as the standard labor cost per hour. How has your explanation of the variances changed?
(Figure)Use the following standard cost card for 1 gallon of ice cream to answer the questions.
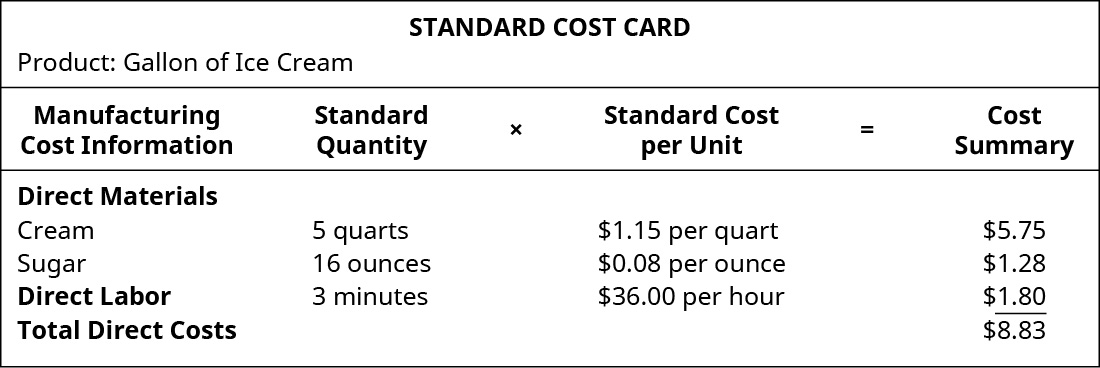
Actual direct costs incurred to make 50 gallons of ice cream:
- 275 quarts of cream at $1.05 per quart
- 832 ounces of sugar at $0.075 per ounce
- 165 minutes of labor at $37 per hour
All material used was bought during the current period.
- Compute the material and labor variances.
- Comment on the results and possible causes of the variances.
(Figure)Use the following standard cost card for 1 gallon of ice cream to answer the questions.
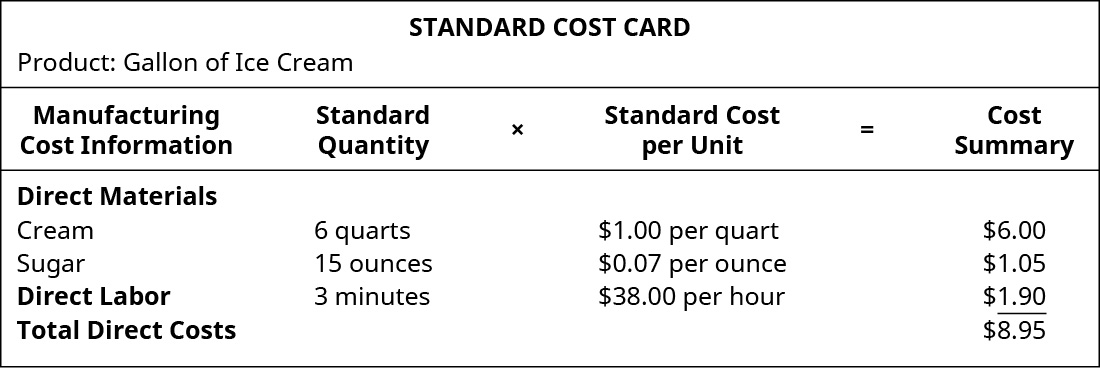
Actual direct costs incurred to make 50 gallons of ice cream:
- 275 quarts of cream at $1.05 per quart
- 832 ounces of sugar at $0.075 per ounce
- 165 minutes of labor at $37 per hour
All materials used were bought during the current period.
- Compute the material and labor variances.
- Comment on the results and possible causes of the variances.
(Figure)In your opinion, is it important that an organization set standards and measure them monthly? Why or why not?
Footnotes
- 1 Jeffrey R. Cohen and Laurie W. Pant. “The Only Thing That Counts Is That Which Is Counted: A Discussion of Behavioral and Ethical Issues in Cost Accounting That Are Relevant for the OB Professor.” September 18, 2018. http://citeseerx.ist.psu.edu/viewdoc/download?doi=10.1.1.1026.5569&rep=rep1&type=pdf
- 2 Jeffrey R. Cohen and Laurie W. Pant. “The Only Thing That Counts Is That Which Is Counted: A Discussion of Behavioral and Ethical Issues in Cost Accounting That Are Relevant for the OB Professor.” September 18, 2018. http://citeseerx.ist.psu.edu/viewdoc/download?doi=10.1.1.1026.5569&rep=rep1&type=pdf
- 3 Jeffrey R. Cohen and Laurie W. Pant. “The Only Thing That Counts Is That Which Is Counted: A Discussion of Behavioral and Ethical Issues in Cost Accounting That Are Relevant for the OB Professor.” September 18, 2018. http://citeseerx.ist.psu.edu/viewdoc/download?doi=10.1.1.1026.5569&rep=rep1&type=pdf
