
67 Explain the Time Value of Money and Calculate Present and Future Values of Lump Sums and Annuities
Patty Graybeal
Your mother gives you $100 cash for a birthday present, and says, “Spend it wisely.” You want to purchase the latest cellular telephone on the market but wonder if this is really the best use of your money. You have a choice: You can spend the money now or spend it in the future. What should you do? Is there a benefit to spending it now as opposed to saving for later use? Does time have an impact on the value of your money in the future? Businesses are confronted with these questions and more when deciding how to allocate investment money. A major factor that affects their investment decisions is the concept of the time value of money.
Time Value of Money Fundamentals
The concept of the time value of money asserts that the value of a dollar today is worth more than the value of a dollar in the future. This is typically because a dollar today can be used now to earn more money in the future. There is also, typically, the possibility of future inflation, which decreases the value of a dollar over time and could lead to a reduction in economic buying power.
At this point, potential effects of inflation can probably best be demonstrated by a couple of examples. The first example is the Ford Mustang. The first Ford Mustang sold in 1964 for $2,368. Today’s cheapest Mustang starts at a list price of $25,680. While a significant portion of this increase is due to additional features on newer models, much of the increase is due to the inflation that occurred between 1964 and 2019.
Similar inflation characteristics can be demonstrated with housing prices. After World War II, a typical small home often sold for between $16,000 and $30,000. Many of these same homes today are selling for hundreds of thousands of dollars. Much of the increase is due to the location of the property, but a significant part is also attributed to inflation. The annual inflation rate for the Mustang between 1964 and 2019 was approximately 4.5%. If we assume that the home sold for $16,500 in 1948 and the price of the home in 2019 was about $500,000, that’s an annual appreciation rate of almost 5%.
Today’s dollar is also more valuable because there is less risk than if the dollar was in a long-term investment, which may or may not yield the expected results. On the other hand, delaying payment from an investment may be beneficial if there is an opportunity to earn interest. The longer payment is delayed, the more available earning potential there is. This can be enticing to businesses and may persuade them to take on the risk of deferment.
Businesses consider the time value of money before making an investment decision. They need to know what the future value is of their investment compared to today’s present value and what potential earnings they could see because of delayed payment. These considerations include present and future values.
Before you learn about present and future values, it is important to examine two types of cash flows: lump sums and annuities.
Lump Sums and Annuities
A lump sum is a one-time payment or repayment of funds at a particular point in time. A lump sum can be either a present value or future value. For a lump sum, the present value is the value of a given amount today. For example, if you deposited $5,000 into a savings account today at a given rate of interest, say 6%, with the goal of taking it out in exactly three years, the $5,000 today would be a present value-lump sum. Assume for simplicity’s sake that the account pays 6% at the end of each year, and it also compounds interest on the interest earned in any earlier years.
In our current example, interest is calculated once a year. However, interest can also be calculated in numerous ways. Some of the most common interest calculations are daily, monthly, quarterly, or annually. One concept important to understand in interest calculations is that of compounding. Compounding is the process of earning interest on previous interest earned, along with the interest earned on the original investment.
Returning to our example, if $5,000 is deposited into a savings account for three years earning 6% interest compounded annually, the amount the $5,000 investment would be worth at the end of three years is $5,955.08 ($5,000 × 1.06 – $5,300 × 1.06 – $5,618 × 1.06 – $5,955.08). The $5,955.08 is the future value of $5,000 invested for three years at 6%. More formally, future value is the amount to which either a single investment or a series of investments will grow over a specified time at a given interest rate or rates. The initial $5,000 investment is the present value. Again, more formally, present value is the current value of a single future investment or a series of investments for a specified time at a given interest rate or rates. Another way to phrase this is to say the $5,000 is the present value of $5,955.08 when the initial amount was invested at 6% for three years. The interest earned over the three-year period would be $955.08, and the remaining $5,000 would be the original deposit of $5,000.
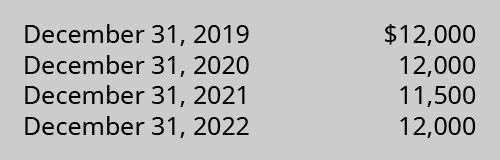
As shown in the example the future value of a lump sum is the value of the given investment at some point in the future. It is also possible to have a series of payments that constitute a series of lump sums. Assume that a business receives the following four cash flows. They constitute a series of lump sums because they are not all the same amount.
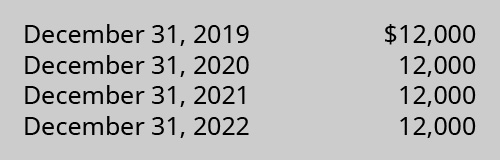
The company would be receiving a stream of four cash flows that are all lump sums. In some situations, the cash flows that occur each time period are the same amount; in other words, the cash flows are even each period. These types of even cash flows occurring at even intervals, such as once a year, are known as an annuity. The following figure shows an annuity that consists of four payments of $12,000 made at the end of each of four years.
The nature of cash flows—single sum cash flows, even series of cash flows, or uneven series of cash flows—have different effects on compounding.
Compounding
Compounding can be applied in many types of financial transactions, such as funding a retirement account or college savings account. Assume that an individual invests $10,000 in a four-year certificate of deposit account that pays 10% interest at the end of each year (in this case 12/31). Any interest earned during the year will be retained until the end of the four-year period and will also earn 10% interest annually.
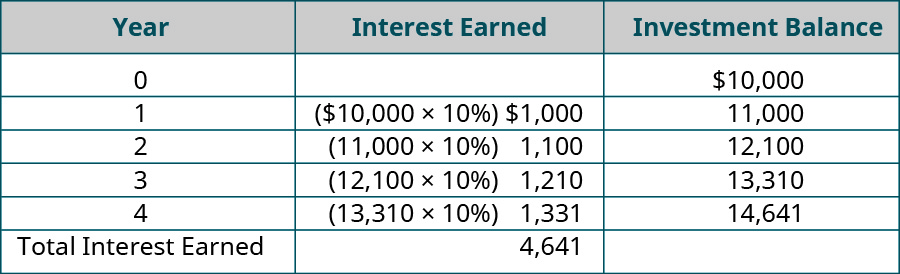
Through the effects of compounding—earning interest on interest—the investor earned $4,641 in interest from the four-year investment. If the investor had removed the interest earned instead of reinvesting it in the account, the investor would have earned $1,000 a year for four years, or $4,000 interest ($10,000 × 10% = $1,000 per year × 4 years = $4,000 total interest). Compounding is a concept that is used to determine future value (more detailed calculations of future value will be covered later in this section). But what about present value? Does compounding play a role in determining present value? The term applied to finding present value is called discounting.
Discounting
Discounting is the procedure used to calculate the present value of an individual payment or a series of payments that will be received in the future based on an assumed interest rate or return on investment. Let’s look at a simple example to explain the concept of discounting.
Assume that you want to accumulate sufficient funds to buy a new car and that you will need $5,000 in three years. Also, assume that your invested funds will earn 8% a year for the three years, and you reinvest any interest earned during the three-year period. If you wanted to take out adequate funds from your savings account to fund the three-year investment, you would need to invest $3,969.16 today and invest it in the account earning 8% for three years. After three years, the $3,969.16 would earn $1,030.84 and grow to exactly the $5,000 that you will need. This is an example of discounting. Discounting is the method by which we take a future value and determine its current, or present, value. An understanding of future value applications and calculations will aid in the understanding of present value uses and calculations.
Future Value
There are benefits to investing money now in hopes of a larger return in the future. These future earnings are possible because of interest payments received as an incentive for tying up money long-term. Knowing what these future earnings will be can help a business decide if the current investment is worth the long-term potential. Recall, the future value (FV) as the value of an investment after a certain period of time. Future value considers the initial amount invested, the time period of earnings, and the earnings interest rate in the calculation. For example, a bank would consider the future value of a loan based on whether a long-time client meets a certain interest rate return when determining whether to approve the loan.
To determine future value, the bank would need some means to determine the future value of the loan. The bank could use formulas, future value tables, a financial calculator, or a spreadsheet application. The same is true for present value calculations. Due to the variety of calculators and spreadsheet applications, we will present the determination of both present and future values using tables. In many college courses today, these tables are used primarily because they are relatively simple to understand while demonstrating the material. For those who prefer formulas, the different formulas used to create each table are printed at the top of the corresponding table. In many finance classes, you will learn how to utilize the formulas. Regarding the use of a financial calculator, while all are similar, the user manual or a quick internet search will provide specific directions for each financial calculator. As for a spreadsheet application such as Microsoft Excel, there are some common formulas, shown in (Figure). In addition, Appendix C provides links to videos and tutorials on using specific aspects of Excel, such as future and present value techniques.
| Excel Formulas | ||
|---|---|---|
| Time Value Component | Excel Formula Shorthand | Excel Formula Detailed |
| Present Value Single Sum | =PV | =PV(Rate, N, Payment, FV) |
| Future Value Single Sum | +FV | =FV(Rate, N, Payment, PV) |
| Present Value Annuity | =PV | =PV(Rate, N, Payment, FV, Type) |
| Future Value Annuity | =FV | =FV(Rate, N, Payment, PV, Type) |
| Net Present Value | =NPV | =NPV(Rate, CF2, CF3, CF4) + CF1 |
| Internal Rate of Return | =IRR | =IRR(Invest, CF1, CF2, CF3) |
| Rate = annual interest rate | ||
| N = number of periods | ||
| Payment = annual payment amount, entered as a negative number, use 0 when calculating both present value of a single sum and future value of a single sum | ||
| FV = future value | ||
| PV = current or present value | ||
| Type = 0 for regular annuity, 1 for annuity due | ||
| CF = cash flow for a period, thus CF1 – cash flow period 1, CF2 – cash flow period 2, etc. | ||
| Invest = initial investment entered as a negative number | ||
Since we will be using the tables in the examples in the body of the chapter, it is important to know there are four possible table, each used under specific conditions ((Figure).
| Time Value of Money Tables | |
|---|---|
| Situation | Table Heading |
| Future Value – Lump Sum | Future Value of $1 |
| Future Value – Annuity (even payment stream) | Future Value of an Annuity |
| Present Value – Lump Sum | Present Value of $1 |
| Present Value – Annuity (even payment stream) | Present Value of an Annuity |
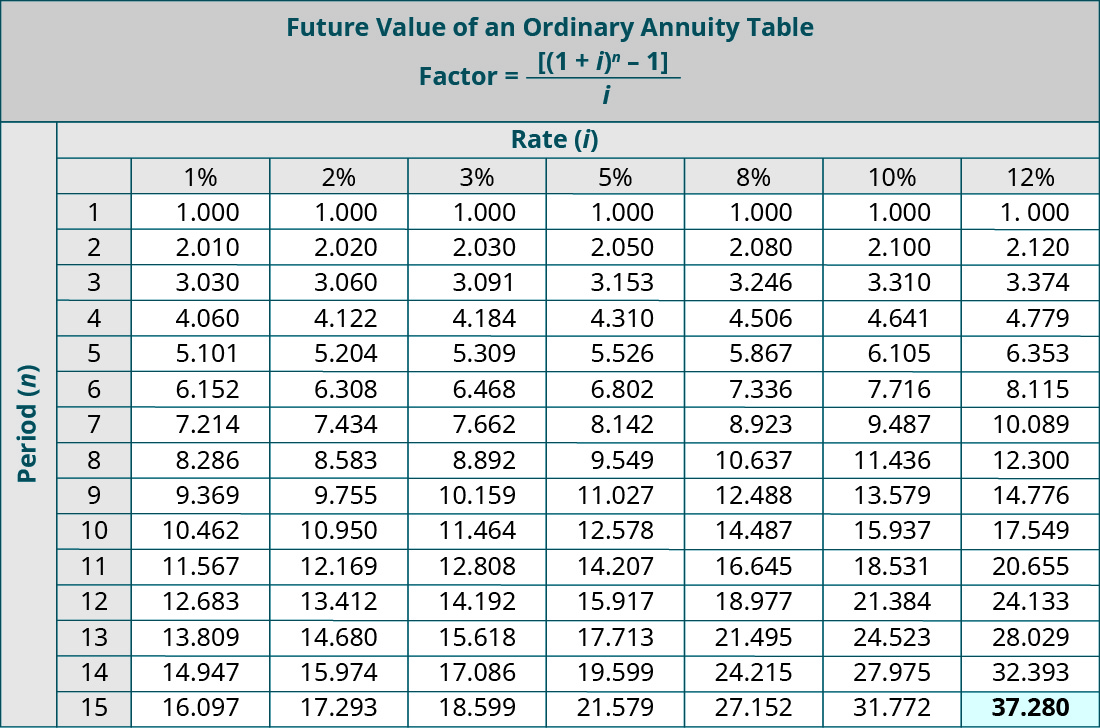
In the prior situation, the bank would use either the Future Value of $1 table or Future Value of an Ordinary Annuity table, samples of which are provided in Appendix B. To use the correct table, the bank needs to determine whether the customer will pay them back at the end of the loan term or periodically throughout the term of the loan. The Future Value of $1 table is used if the customer will pay back at the end of the period; if the payments will be made periodically throughout the term of the loan, they will use the Future Value of an Annuity table. Choosing the correct table to use is critical for accurate determination of the future value. The application in other business matters is the same: a business needs to also consider if they are making an investment with a repayment in one lump sum or in an annuity structure before choosing a table and making the calculation. In the tables, the columns show interest rates (i) and the rows show periods (n). The interest columns represent the anticipated interest rate payout for that investment. Interest rates can be based on experience, industry standards, federal fiscal policy expectations, and risk investment. Periods represent the number of years until payment is received. The intersection of the expected payout years and the interest rate is a number called a future value factor. The future value factor is multiplied by the initial investment cost to produce the future value of the expected cash flows (or investment return).
Future Value of $1
A lump sum payment is the present value of an investment when the return will occur at the end of the period in one installment. To determine this return, the Future Value of $1 table is used.
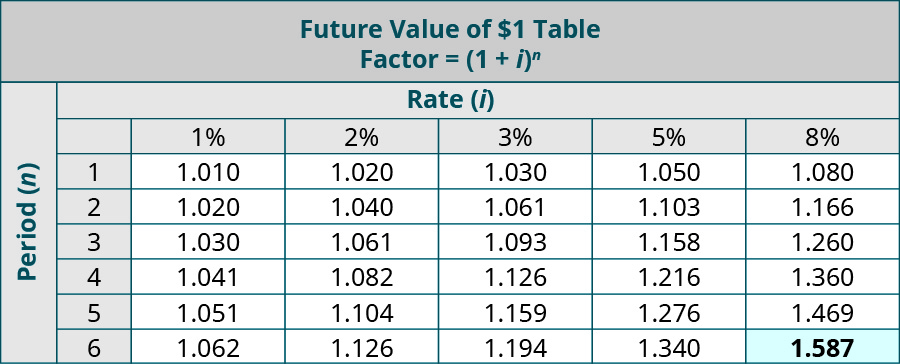
For example, you are saving for a vacation you plan to take in 6 years and want to know how much your initial savings will yield in the future. You decide to place $4,500 in an investment account now that yields an anticipated annual return of 8%. Looking at the FV table, n = 6 years, and i = 8%, which return a future value factor of 1.587. Multiplying this factor by the initial investment amount of $4,500 produces $7,141.50. This means your initial savings of $4,500 will be worth approximately $7,141.50 in 6 years.
Future Value of an Ordinary Annuity
An ordinary annuity is one in which the payments are made at the end of each period in equal installments. A future value ordinary annuity looks at the value of the current investment in the future, if periodic payments were made throughout the life of the series.
For example, you are saving for retirement and expect to contribute $10,000 per year for the next 15 years to a 401(k) retirement plan. The plan anticipates a periodic interest yield of 12%. How much would your investment be worth in the future meeting these criteria? In this case, you would use the Future Value of an Ordinary Annuity table. The relevant factor where n = 15 and i = 12% is 37.280. Multiplying the factor by the amount of the cash flow yields a future value of these installment savings of (37.280 × $10,000) $372,800. Therefore, you could expect your investment to be worth $372,800 at the end of 15 years, given the parameters.
Let’s now examine how present value differs from future value in use and computation.
Determine the future value for each of the following situations. Use the future value tables provided in Appendix B when needed, and round answers to the nearest cent where required.
- You are saving for a car and you put away $5,000 in a savings account. You want to know how much your initial savings will be worth in 7 years if you have an anticipated annual interest rate of 5%.
- You are saving for retirement and make contributions of $11,500 per year for the next 14 years to your 403(b) retirement plan. The interest rate yield is 8%.
Solution
A. Use FV of $1 table. Future value factor where n = 7 and i = 5 is 1.407. 1.407 × 5,000 = $7,035. B. Use FV of an ordinary annuity table. Future value factor where n = 14 and i = 8 is 24.215. 24.215 × 11,500 = $278,472.50.
Present Value
It is impossible to compare the value or potential purchasing power of the future dollar to today’s dollar; they exist in different times and have different values. Present value (PV) considers the future value of an investment expressed in today’s value. This allows a company to see if the investment’s initial cost is more or less than the future return. For example, a bank might consider the present value of giving a customer a loan before extending funds to ensure that the risk and the interest earned are worth the initial outlay of cash.
Similar to the Future Value tables, the columns show interest rates (i) and the rows show periods (n) in the Present Value tables. Periods represent how often interest is compounded (paid); that is, periods could represent days, weeks, months, quarters, years, or any interest time period. For our examples and assessments, the period (n) will almost always be in years. The intersection of the expected payout years (n) and the interest rate (i) is a number called a present value factor. The present value factor is multiplied by the initial investment cost to produce the present value of the expected cash flows (or investment return).

The two tables provided in Appendix B for present value are the Present Value of $1 and the Present Value of an Ordinary Annuity. As with the future value tables, choosing the correct table to use is critical for accurate determination of the present value.
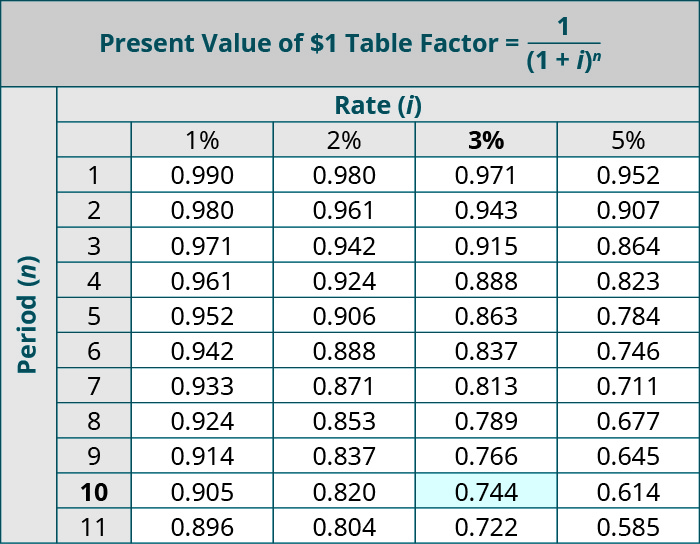
Present Value of $1
When referring to present value, the lump sum return occurs at the end of a period. A business must determine if this delayed repayment, with interest, is worth the same as, more than, or less than the initial investment cost. If the deferred payment is more than the initial investment, the company would consider an investment.
To calculate present value of a lump sum, we should use the Present Value of $1 table. For example, you are interested in saving money for college and want to calculate how much you would need put in the bank today to return a sum of $40,000 in 10 years. The bank returns an interest rate of 3% per year during these 10 years. Looking at the PV table, n = 10 years and i = 3% returns a present value factor of 0.744. Multiplying this factor by the return amount of $40,000 produces $29,760. This means you would need to put in the bank now approximately $29,760 to have $40,000 in 10 years.
As mentioned, to determine the present value or future value of cash flows, a financial calculator, a program such as Excel, knowledge of the appropriate formulas, or a set of tables must be used. Though we illustrate examples in the text using tables, we recognize the value of these other calculation instruments and have included chapter assessments that use multiple approaches to determining present and future value. Knowledge of different approaches to determining present and future value is useful as there are situations, such as having fractional interest rates, 8.45% for example, in which a financial calculator or a program such as Excel would be needed to accurately determine present or future value.
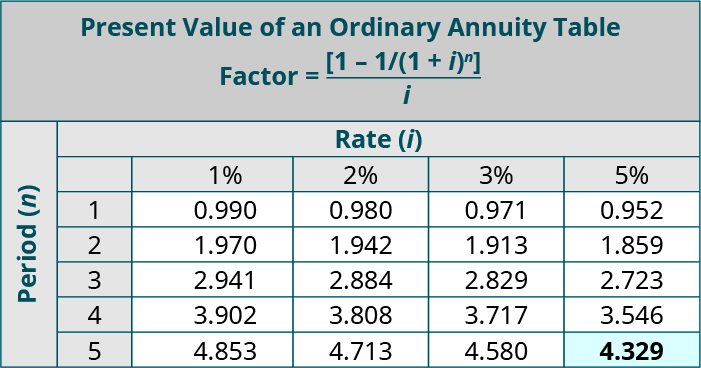
Annuity Table
As discussed previously, annuities are a series of equal payments made over time, and ordinary annuities pay the equal installment at the end of each payment period within the series. This can help a business understand how their periodic returns translate into today’s value.
For example, assume that Sam needs to borrow money for college and anticipates that she will be able to repay the loan in $1,200 annual payments for each of 5 years. If the lender charges 5% per year for similar loans, how much cash would the bank be willing to lend Sam today? In this case, she would use the Present Value of an Ordinary Annuity table in Appendix B, where n = 5 and i = 5%. This yields a present value factor of 4.329. The current value of the cash flow each period is calculated as 4.329 × $1,200 = $5,194.80. Therefore, Sam could borrow $5,194.80 now given the repayment parameters.
Our focus has been on examples of ordinary annuities (annuities due and other more complicated annuity examples are addressed in advanced accounting courses). With annuities due, the cash flow occurs at the start of the period. For example, if you wanted to deposit a lump sum of money into an account and make monthly rent payments starting today, the first payment would be made the same day that you made the deposit into the funding account. Because of this timing difference in the withdrawals from the annuity due, the process of calculating annuity due is somewhat different from the methods that you’ve covered for ordinary annuities.
Determine the present value for each of the following situations. Use the present value tables provided in Appendix B when needed, and round answers to the nearest cent where required.
- You are saving for college and you want to return a sum of $100,000 in 12 years. The bank returns an interest rate of 5% after these 12 years.
- You need to borrow money for college and can afford a yearly payment to the lending institution of $1,000 per year for the next 8 years. The interest rate charged by the lending institution is 3% per year.
Solution
a. Use PV of $1 table. Present value factor where n = 12 and i = 5 is 0.557. 0.557 × $100,000 = $55,700. b. Use PV of an ordinary annuity table. Present value factor where n = 8 and i = 3 is 7.020. 7.020 × $1,000 = $7,020.
For a lucky few, winning the lottery can be a dream come true and the option to take a one-time payout or receive payments over several years does not seem to matter at the time. This lottery payout calculator shows how time value of money may affect your take-home winnings.
Key Concepts and Summary
- A dollar is worth more today than it will be in the future. This is due to many reasons including the power of investment in today’s economy, market inflation, and the ability to use the money in the present to make more money in the future, with interest.
- Present value expresses the future value of a dollar in today’s (present) value. Present value tables, showing the present value factor intersection of periods and interest rate, are used to multiply by the final payout amount to compute today’s value.
- The future value shows what the value of an investment will be after a certain period of time. Future value tables, showing the future value factor intersection of periods and interest rate, are used to multiply by the initial investment amount to compute future value.
- A lump sum is a one-time payment after a certain period of time, whereas an ordinary annuity involves equal installments in a series of payments over time. A business can use lump sum or ordinary annuity calculations for present value and future value calculations.
(Figure)You are explaining time value of money factors to your friend. Which factor would you explain as being larger?
- The future value of $1 for 12 periods at 6% is larger.
- The present value of $1 for 12 periods at 6% is larger.
- Neither one is larger because they are equal.
- There is not enough information given to answer this question.
(Figure)If you are saving the same amount each month in order to buy a new sports car when the new models are released, which of the following will help you determine the savings needed?
- future value of one dollar ($1)
- present value of one dollar ($1)
- future value of an ordinary annuity
- present value of an ordinary annuity
C
(Figure)You want to invest $8,000 at an annual interest rate of 8% that compounds annually for 12 years. Which table will help you determine the value of your account at the end of 12 years?
- future value of one dollar ($1)
- present value of one dollar ($1)
- future value of an ordinary annuity
- present value of an ordinary annuity
(Figure)Using the information provided, what transaction represents the best application of the present value of an annuity due of $1?
- Falcon Products leases an office building for 8 years with annual lease payments of $100,000 to be made at the beginning of each year.
- Compass, Inc., signs a note of $32,000, which requires the company to pay back the principal plus interest in four years.
- Bahwat Company plans to deposit a lump sum of $100,000 for the construction of a solar farm in 4 years.
- NYC Industries leases a car for 4 yearly annual lease payments of $12,000, where payments are made at the end of each year.
A
(Figure)Grummet Company is acquiring a new wood lathe with a cash purchase price of $80,000. The Wood Master Industries (the manufacturer) has agreed to accept $23,500 at the end of each of the next 4 years. Based on this deal, how much interest will Grummet pay over the life of the loan?
- $94,000
- $80,000
- $23,500
- $14,000
(Figure)The process that determines the present value of a single payment or stream of payments to be received is ________.
- compounding
- discounting
- annuity
- lump-sum
B
(Figure)The process of reinvesting interest earned to generate additional earnings over time is ________.
- compounding
- discounting
- annuity
- lump-sum
(Figure)What is future value and what is one example where it might be used?
(Figure)Why do businesses consider time value of money before making an investment decision?
They need to know what the future value is of their investment compared to today’s present value, and what potential earnings they could see because of delayed payment.
(Figure)What determines the anticipated interest rate payout for an investment?
(Figure)To calculate present value of a lump sum, which table would be used?
The Present Value of $1 table.
(Figure)What is the definition of present value?
(Figure)You put $250 in the bank for 5 years at 12%.
- If interest is added at the end of the year, how much will you have in the bank after one year? Calculate the amount you will have in the bank at the end of year two and continue to calculate all the way to the end of the fifth year.
- Use the future value of $1 table in Appendix B and verify that your answer is correct.
(Figure)If you invest $12,000 today, how much will you have in (for further instructions on future value in Excel, see Appendix C):
- 10 years at 9%
- 8 years at 12%
- 14 years at 15%
- 19 years at 18%
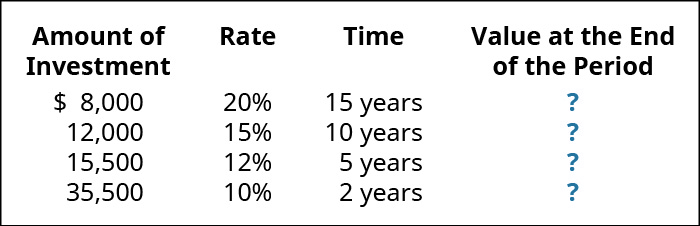
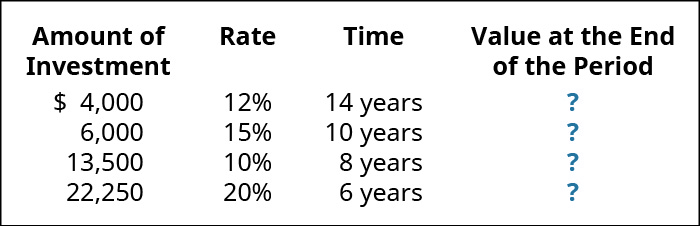
(Figure)You have been depositing money into an account yearly based on the following amounts, rates, and times. What is the value of that investment account at the end of that period?
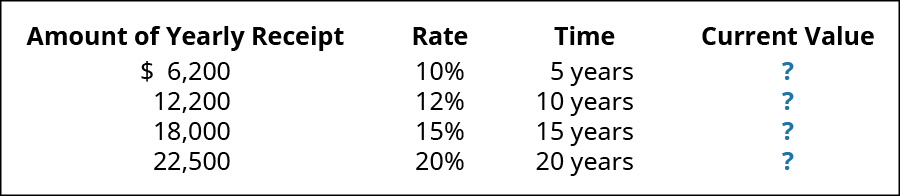
(Figure)How much would you invest today in order to receive $30,000 in each of the following (for further instructions on present value in Excel, see Appendix C):
- 10 years at 9%
- 8 years at 12%
- 14 years at 15%
- 19 years at 18%
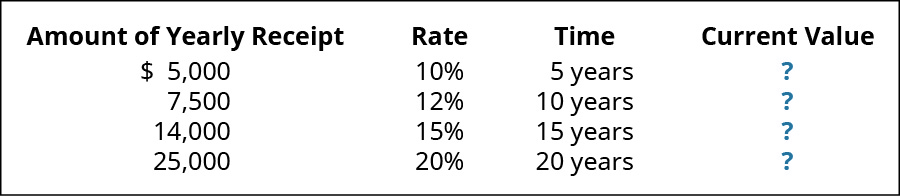
(Figure)Your friend has a trust fund that will pay her the following amounts at the given interest rate for the given number of years. Calculate the current (present) value of your friend’s trust fund payments. For further instructions on future value in Excel, see Appendix C.
(Figure)Julio Company is considering the purchase of a new bubble packaging machine. If the machine will provide $20,000 annual savings for 10 years and can be sold for $50,000 at the end of the period, what is the present value of the machine investment at a 9% interest rate with savings realized at year end?
(Figure)How much must be invested now to receive $30,000 for 10 years if the first $30,000 is received one year from now and the rate is 8%?
(Figure)You put $600 in the bank for 3 years at 15%.
- If interest is added at the end of the year, how much will you have in the bank after one year? Calculate the amount you will have in the bank at the end of year two and continue to calculate all the way to the end of the third year.
- Use the future value of $1 table in Appendix B and verify that your answer is correct.
(Figure)If you invest $15,000 today, how much will you have in (for further instructions on future value in Excel, see Appendix C):
- 20 years at 22%
- 12 years at 10%
- 5 years at 14%
- 2 years at 7%
(Figure)You have been depositing money into an account yearly based on the following investment amounts, rates and times. What is the value of that investment account at the end of that period?
(Figure)How much would you invest today in order to receive $30,000 in each of the following (for further instructions on present value in Excel, see Appendix C):
- 20 years at 22%
- 12 years at 10%
- 5 years at 14%
- 2 years at 7%
(Figure)Your friend has a trust fund that will pay her the following amounts at the given interest rate for the given number of years. Calculate the current (present) value of your friend’s trust fund payments. For further instructions on present value in Excel, see Appendix C.
(Figure)Conestoga Plumbing plans to invest in a new pump that is anticipated to provide annual savings for 10 years of $50,000. The pump can be sold at the end of the period for $100,000. What is the present value of the investment in the pump at a 9% interest rate given that savings are realized at year end?
(Figure)How much must be invested now to receive $50,000 for 8 years if the first $50,000 is received in one year and the rate is 10%?
(Figure)Use the tables in Appendix B to answer the following questions.
- If you would like to accumulate $2,500 over the next 4 years when the interest rate is 15%, how much do you need to deposit in the account?
- If you place $6,200 in a savings account, how much will you have at the end of 7 years with a 12% interest rate?
- You invest $8,000 per year for 10 years at 12% interest, how much will you have at the end of 10 years?
- You win the lottery and can either receive $750,000 as a lump sum or $50,000 per year for 20 years. Assuming you can earn 8% interest, which do you recommend and why?
(Figure)Ralston Consulting, Inc., has a $25,000 overdue debt with Supplier No. 1. The company is low on cash, with only $7,000 in the checking account and does not want to borrow any more cash. Supplier No. 1 agrees to settle the account in one of two ways:
Option 1: Pay $7,000 now and $23,750 when some large projects are finished, two years from today.
Option 2: Pay $35,000 three years from today, when even larger projects are finished.
Assuming that the only factor in the decision is the cost of money (8%), which option should Ralston choose?
(Figure)Use the tables in Appendix B to answer the following questions.
- If you would like to accumulate $4,200 over the next 6 years when the interest rate is 8%, how much do you need to deposit in the account?
- If you place $8,700 in a savings account, how much will you have at the end of 12 years with an interest rate of 8%?
- You invest $2,000 per year, at the end of the year, for 20 years at 10% interest. How much will you have at the end of 20 years?
- You win the lottery and can either receive $500,000 as a lump sum or $60,000 per year for 20 years. Assuming you can earn 3% interest, which do you recommend and why?
(Figure)Chang Consulting, Inc., has a $15,000 overdue debt with Supplier No. 1. The company is low on cash, with only $4,000 in the checking account and does not want to borrow any more cash. Supplier No. 1 agrees to settle the account in one of two ways:
Option 1: Pay $4,000 now and $18,750 when some large projects are finished, two years from today.
Option 2: Pay $25,000 three years from today, when even larger projects are finished.
Assuming that the only factor in the decision is the cost of money (8%), which option should Clary choose?
(Figure)Would you rather have $7,500 today or at the end of 20 years after it has been invested at 15%? Explain your answer.
Glossary
- annuity
- series of equal payments made over time
- annuities due
- equal installments paid at the beginning of each payment period within the series
- compounding
- earning interest on previous interest earned, along with the interest earned on the original investment
- discounting
- process that determines the present value of a single payment or stream of payments to be received
- future value (FV)
- value of an investment after a certain period of time
- lump sum
- one-time payment or repayment of funds at a particular point in time
- ordinary annuities
- equal installments paid at the end of each payment period within the series
- present value (PV)
- future value of an investment expressed in today’s value
- time value of money
- assertion that the value of a dollar today is worth more than the value of a dollar in the future
