
14 Explain Contribution Margin and Calculate Contribution Margin per Unit, Contribution Margin Ratio, and Total Contribution Margin
Patty Graybeal
Before examining contribution margins, let’s review some key concepts: fixed costs, relevant range, variable costs, and contribution margin. Fixed costs are those costs that will not change within a given range of production. For example, in the current case, the fixed costs will be the student sales fee of $100. No matter how many shirts the club produces within the relevant range, the fee will be locked in at $100. The relevant range is the anticipated production activity level. Fixed costs remain constant within a relevant range. If production levels exceed expectations, then additional fixed costs will be required.
For example, assume that the students are going to lease vans from their university’s motor pool to drive to their conference. A university van will hold eight passengers, at a cost of $200 per van. If they send one to eight participants, the fixed cost for the van would be $200. If they send nine to sixteen students, the fixed cost would be $400 because they will need two vans. We would consider the relevant range to be between one and eight passengers, and the fixed cost in this range would be $200. If they exceed the initial relevant range, the fixed costs would increase to $400 for nine to sixteen passengers.
Variable costs are those costs that vary per unit of production. Direct materials are often typical variable costs, because you normally use more direct materials when you produce more items. In our example, if the students sold 100 shirts, assuming an individual variable cost per shirt of $10, the total variable costs would be $1,000 (100 × $10). If they sold 250 shirts, again assuming an individual variable cost per shirt of $10, then the total variable costs would $2,500 (250 × $10).
Contribution margin is the amount by which a product’s selling price exceeds its total variable cost per unit. This difference between the sales price and the per unit variable cost is called the contribution margin because it is the per unit contribution toward covering the fixed costs. It typically is calculated by comparing the sales revenue generated by the sale of one item versus the variable cost of the item:

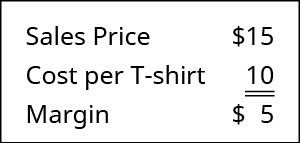
In our example, the sales revenue from one shirt is $15 and the variable cost of one shirt is $10, so the individual contribution margin is $5. This $5 contribution margin is assumed to first cover fixed costs first and then realized as profit.
As you will see, it is not just small operations, such as the accounting club scenario provided in Why It Matters, that benefit from cost-volume-profit (CVP) analysis. At some point, all businesses find themselves asking the same basic questions: How many units must be sold in order to reach a desired income level? How much will each unit cost? How much of the sales price from each unit will help cover our fixed costs? For example, Starbucks faces these same questions every day, only on a larger scale. When they introduce new menu items, such as seasonal specialty drinks, they must determine the fixed and variable costs associated with each item. Adding menu items may not only increase their fixed costs in the short run (via advertising and promotions) but will bring new variable costs. Starbucks needs to price these drinks in a way that covers the variable costs per unit and additional fixed costs and contributes to overall net income. Regardless of how large or small the enterprise, understanding how fixed costs, variable costs, and volume are related to income is vital for sound decision-making.

Understanding how to use fixed costs, variable costs, and sales in CVP analyses requires an understanding of the term margin. You may have heard that restaurants and grocery stores have very low margins, while jewelry stores and furniture stores have very high margins. What does “margin” mean? In the broadest terms, margin is the difference between a product or service’s selling price and its cost of production. Recall the accounting club’s T-shirt sale. The difference between the sales price per T-shirt and the purchase price of the T-shirts was the accounting club’s margin:
Recall that Building Blocks of Managerial Accounting explained the characteristics of fixed and variable costs and introduced the basics of cost behavior. Let’s now apply these behaviors to the concept of contribution margin. The company will use this “margin” to cover fixed expenses and hopefully to provide a profit. Let’s begin by examining contribution margin on a per unit basis.
Unit Contribution Margin
When the contribution margin is calculated on a per unit basis, it is referred to as the contribution margin per unit or unit contribution margin. You can find the contribution margin per unit using the equation shown in (Figure).

It is important to note that this unit contribution margin can be calculated either in dollars or as a percentage. To demonstrate this principle, let’s consider the costs and revenues of Hicks Manufacturing, a small company that manufactures and sells birdbaths to specialty retailers.
Hicks Manufacturing sells its Blue Jay Model for $1100 and incurs variable costs of $20 per unit. In order to calculate their per unit contribution margin, we use the formula in (Figure) to determine that on a per unit basis, their contribution margin is:
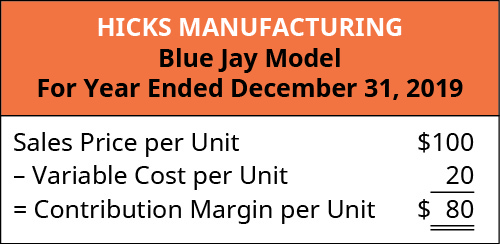
This means that for every Blue Jay model they sell, they will have $80 to contribute toward covering fixed costs, such as rent, insurance, and manager salaries. But Hicks Manufacturing manufactures and sells more than one model of birdbath. They also sell a Cardinal Model for $75, and these birdbaths incur variable costs of $15 per unit. For the Cardinal Model, their contribution margin on a per unit basis is the $75 sales price less the $15 per unit variable costs is as follows:
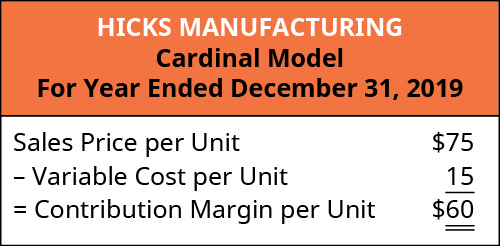
This demonstrates that, for every Cardinal model they sell, they will have $60 to contribute toward covering fixed costs and, if there is any left, toward profit. Every product that a company manufactures or every service a company provides will have a unique contribution margin per unit. In these examples, the contribution margin per unit was calculated in dollars per unit, but another way to calculate contribution margin is as a ratio (percentage).
Contribution Margin Ratio
The contribution margin ratio is the percentage of a unit’s selling price that exceeds total unit variable costs. In other words, contribution margin is expressed as a percentage of sales price and is calculated using this formula:

For Hicks Manufacturing and their Blue Jay Model, the contribution margin ratio will be

At a contribution margin ratio of 80%, approximately $0.80 of each sales dollar generated by the sale of a Blue Jay Model is available to cover fixed expenses and contribute to profit. The contribution margin ratio for the birdbath implies that, for every $1 generated by the sale of a Blue Jay Model, they have $0.80 that contributes to fixed costs and profit. Thus, 20% of each sales dollar represents the variable cost of the item and 80% of the sales dollar is margin. Just as each product or service has its own contribution margin on a per unit basis, each has a unique contribution margin ratio. Although this process is extremely useful for analyzing the profitability of a single product, good, or service, managers also need to see the “big picture” and will examine contribution margin in total across all products, goods, or services.
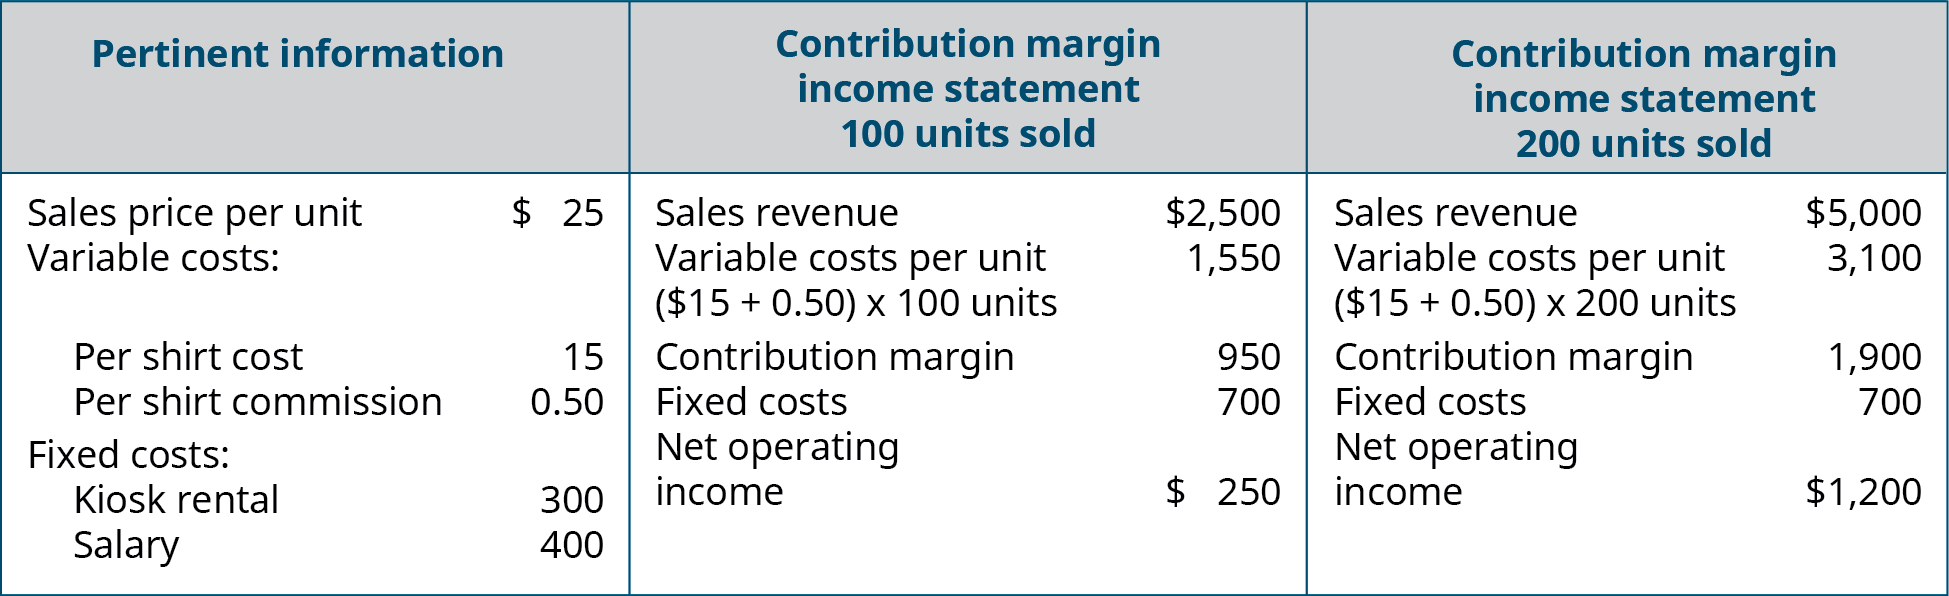
You rent a kiosk in the mall for $300 a month and use it to sell T-shirts with college logos from colleges and universities all over the world. You sell each T-shirt for $25, and your cost for each shirt is $15. You also pay your sales person a commission of $0.50 per T-shirt sold in addition to a salary of $400 per month. Construct a contribution margin income statement for two different months: in one month, assume 100 T-shirts are sold, and in the other, assume 200 T-shirts are sold.
Solution
Total Contribution Margin
This “big picture” is gained by calculating total contribution margin—the total amount by which total sales exceed total variable costs. We calculate total contribution margin by multiplying per unit contribution margin by sales volume or number of units sold. This approach allows managers to determine how much profit a company is making before paying its fixed expenses. For Hicks Manufacturing, if the managers want to determine how much their Blue Jay Model contributes to the overall profitability of the company, they can calculate total contribution margin as follows:
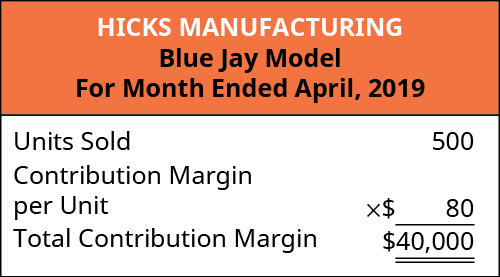
For the month of April, sales from the Blue Jay Model contributed $36,000 toward fixed costs. Looking at contribution margin in total allows managers to evaluate whether a particular product is profitable and how the sales revenue from that product contributes to the overall profitability of the company. In fact, we can create a specialized income statement called a contribution margin income statement to determine how changes in sales volume impact the bottom line.
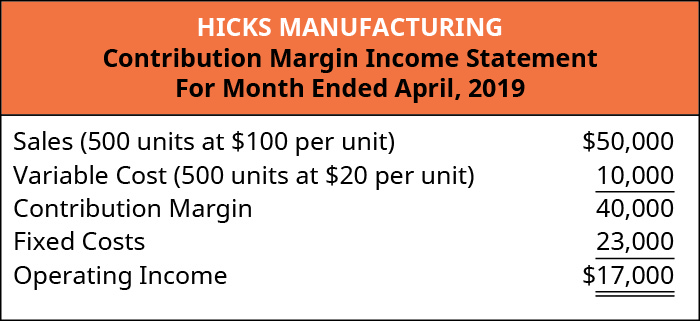
To illustrate how this form of income statement can be used, contribution margin income statements for Hicks Manufacturing are shown for the months of April and May.
In April, Hicks sold 500 Blue Jay Models at $100 per unit, which resulted in the operating income shown on the contribution margin income statement:
In May, 750 of the Blue Jay models were sold as shown on the contribution margin income statement. When comparing the two statements, take note of what changed and what remained the same from April to May.
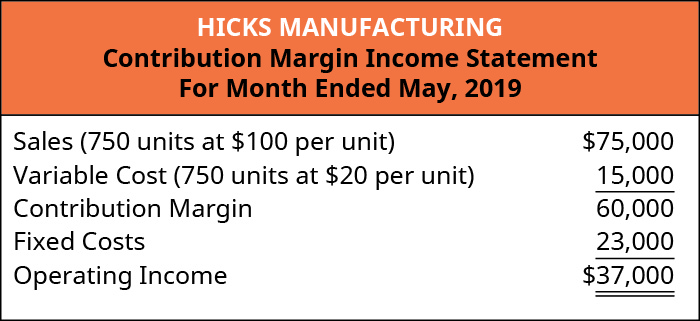
Using this contribution margin format makes it easy to see the impact of changing sales volume on operating income. Fixed costs remained unchanged; however, as more units are produced and sold, more of the per-unit sales price is available to contribute to the company’s net income.
Before going further, let’s note several key points about CVP and the contribution margin income statement. First, the contribution margin income statement is used for internal purposes and is not shared with external stakeholders. Secondly, in this specialized income statement, when “operating income” is shown, it actually refers to “net operating income” without regard to income taxes. Companies can also consider taxes when performing a CVP analysis to project both net operating income and net income. (The preparation of contribution margin income statements with regard to taxes is covered in advanced accounting courses; here, we will consider net income as net operating income without regard to taxes.)
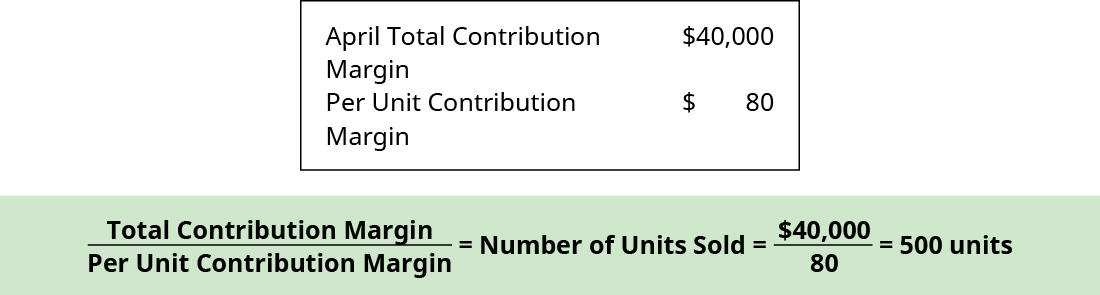
Regardless of whether contribution margin is calculated on a per-unit basis, calculated as a ratio, or incorporated into an income statement, all three express how much sales revenue is available to cover fixed expenses and contribute to profit. Let’s examine how all three approaches convey the same financial performance, although represented somewhat differently.
You will recall that the per-unit contribution margin was $80 for a Hicks Blue Jay birdbath. When Hicks sold 500 units, each unit contributed $80 to fixed expenses and profit, which can be verified from April’s income statement:
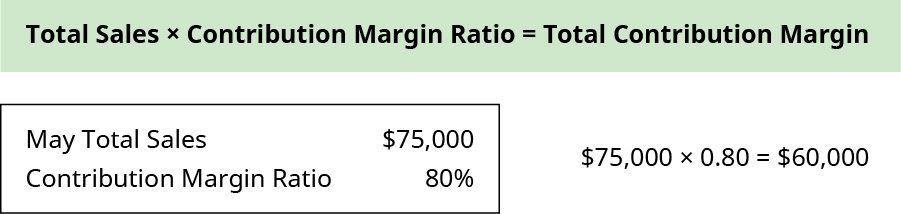
Now, let’s use May’s Contribution Margin Income Statement as previously calculated to verify the contribution margin based on the contribution margin ratio previously calculated, which was 80%, by applying this formula:
Regardless of how contribution margin is expressed, it provides critical information for managers. Understanding how each product, good, or service contributes to the organization’s profitability allows managers to make decisions such as which product lines they should expand or which might be discontinued. When allocating scarce resources, the contribution margin will help them focus on those products or services with the highest margin, thereby maximizing profits.
The Evolution of Cost-Volume-Profit Relationships
The CVP relationships of many organizations have become more complex recently because many labor-intensive jobs have been replaced by or supplemented with technology, changing both fixed and variable costs. For those organizations that are still labor-intensive, the labor costs tend to be variable costs, since at higher levels of activity there will be a demand for more labor usage. For example, assuming one worker is needed for every 50 customers per hour, we might need two workers for an average sales season, but during the Thanksgiving and Christmas season, the store might experience 250 customers per hour and thus would need five workers.
However, the growing trend in many segments of the economy is to convert labor-intensive enterprises (primarily variable costs) to operations heavily dependent on equipment or technology (primarily fixed costs). For example, in retail, many functions that were previously performed by people are now performed by machines or software, such as the self-checkout counters in stores such as Walmart, Costco, and Lowe’s. Since machine and software costs are often depreciated or amortized, these costs tend to be the same or fixed, no matter the level of activity within a given relevant range.
In China, completely unmanned grocery stores have been created that use facial recognition for accessing the store. Patrons will shop, bag the purchased items, leave the store, and be billed based on what they put in their bags. Along with managing the purchasing process, inventory is maintained by sensors that let managers know when they need to restock an item.
In the United States, similar labor-saving processes have been developed, such as the ability to order groceries or fast food online and have it ready when the customer arrives. Another major innovation affecting labor costs is the development of driverless cars and trucks (primarily fixed costs), which will have a major impact on the number of taxi and truck drivers in the future (primarily variable costs). Do these labor-saving processes change the cost structure for the company? Are variable costs decreased? What about fixed costs? Let’s look at this in more detail.
When ordering food through an app, there is no need to have an employee take the order, but someone still needs to prepare the food and package it for the customer. The variable costs associated with the wages of order takers will likely decrease, but the fixed costs associated with additional technology to allow for online ordering will likely increase. When grocery customers place their orders online, this not only requires increased fixed costs for the new technology, but it can also increase variable labor costs, as employees are needed to fill customers’ online orders. Many stores may move cashier positions to online order fulfillment rather than hiring additional employees. Other stores may have employees fill online grocery orders during slow or downtimes.
Using driverless cars and trucks decreases the variable costs tied to the wages of the drivers but requires a major investment in fixed-cost assets—the autonomous vehicles—and companies would need to charge prices that allowed them to recoup their expensive investments in the technology as well as make a profit. Alternatively, companies that rely on shipping and delivery companies that use driverless technology may be faced with an increase in transportation or shipping costs (variable costs). These costs may be higher because technology is often more expensive when it is new than it will be in the future, when it is easier and more cost effective to produce and also more accessible. A good example of the change in cost of a new technological innovation over time is the personal computer, which was very expensive when it was first developed but has decreased in cost significantly since that time. The same will likely happen over time with the cost of creating and using driverless transportation.
You might wonder why a company would trade variable costs for fixed costs. One reason might be to meet company goals, such as gaining market share. Other reasons include being a leader in the use of innovation and improving efficiencies. If a company uses the latest technology, such as online ordering and delivery, this may help the company attract a new type of customer or create loyalty with longstanding customers. In addition, although fixed costs are riskier because they exist regardless of the sales level, once those fixed costs are met, profits grow. All of these new trends result in changes in the composition of fixed and variable costs for a company and it is this composition that helps determine a company’s profit.
As you will learn in future chapters, in order for businesses to remain profitable, it is important for managers to understand how to measure and manage fixed and variable costs for decision-making. In this chapter, we begin examining the relationship among sales volume, fixed costs, variable costs, and profit in decision-making. We will discuss how to use the concepts of fixed and variable costs and their relationship to profit to determine the sales needed to break even or to reach a desired profit. You will also learn how to plan for changes in selling price or costs, whether a single product, multiple products, or services are involved.
You are evaluating orders from two new customers, but you will only be able to accept one of the orders without increasing your fixed costs. Management has directed you to choose the one that is most profitable for the company. Customer A is ordering 500 units and is willing to pay $200 per unit, and these units have a contribution margin of $60 per unit. Customer B is ordering 1,000 units and is willing to pay $140 per unit, and these units have a contribution margin ratio of 40%. Which order do you select and why?
Watch this video from Investopedia reviewing the concept of contribution margin to learn more. Keep in mind that contribution margin per sale first contributes to meeting fixed costs and then to profit.
Key Concepts and Summary
- Contribution margin can be used to calculate how much of every dollar in sales is available to cover fixed expenses and contribute to profit.
- Contribution margin can be expressed on a per-unit basis, as a ratio, or in total.
- A specialized income statement, the Contribution Margin Income Statement, can be useful in looking at total sales and total contribution margin at varying levels of activity.
(Figure)The amount of a unit’s sales price that helps to cover fixed expenses is its ________.
- contribution margin
- profit
- variable cost
- stepped cost
A
(Figure)A company’s product sells for $150 and has variable costs of $60 associated with the product. What is its contribution margin per unit?
- $40
- $60
- $90
- $150
(Figure)A company’s product sells for $150 and has variable costs of $60 associated with the product. What is its contribution margin ratio?
- 10%
- 40%
- 60%
- 90%
C
(Figure)A company’s contribution margin per unit is $25. If the company increases its activity level from 200 units to 350 units, how much will its total contribution margin increase?
- $1,250
- $3,750
- $5,000
- $8,750
(Figure)Define and explain contribution margin on a per unit basis.
Answers will vary. Responses should include that per-unit contribution margin is the amount by which a product’s selling price exceeds it total variable cost per unit.
(Figure)Define and explain contribution margin ratio.
(Figure)Explain how a contribution margin income statement can be used to determine profitability.
Answers will vary. Responses should include that contribution income statements express total contribution margin for a given level of activity and can be useful in making decisions about product pricing and optimal levels of activity.
(Figure)Calculate the per-unit contribution margin of a product that has a sale price of $200 if the variable costs per unit are $65.
(Figure)Calculate the per-unit contribution margin of a product that has a sale price of $400 if the variable costs per unit are $165.
(Figure)A product has a sales price of $150 and a per-unit contribution margin of $50. What is the contribution margin ratio?
(Figure)A product has a sales price of $250 and a per-unit contribution margin of $75. What is the contribution margin ratio?
(Figure)Calculate the per-unit contribution margin of a product that has a sale price of $150 if the variable costs per unit are $40.
(Figure)Calculate the per-unit contribution margin of a product that has a sale price of $350 if the variable costs per unit are $95.
(Figure)A product has a sales price of $175 and a per-unit contribution margin of $75. What is the contribution margin ratio?
(Figure)A product has a sales price of $90 and a per-unit contribution margin of $30. What is the contribution margin ratio?
(Figure)A company sells small motors as a component part to automobiles. The Model 101 motor sells for $850 and has per-unit variable costs of $400 associated with its production. The company has fixed expenses of $90,000 per month. In August, the company sold 425 of the Model 101 motors.
- Calculate the contribution margin per unit for the Model 101.
- Calculate the contribution margin ratio of the Model 101.
- Prepare a contribution margin income statement for the month of August.
(Figure)A company manufactures and sells racing bicycles to specialty retailers. The Bomber model sells for $450 and has per-unit variable costs of $200 associated with its production. The company has fixed expenses of $40,000 per month. In May, the company sold 225 of the Bomber model bikes.
- Calculate the contribution margin per unit for the Bomber.
- Calculate the contribution margin ratio of the Bomber.
- Prepare a contribution margin income statement for the month of May.
(Figure)A company sells mulch by the cubic yard. Grade A much sells for $150 per cubic yard and has variable costs of $65 per cubic yard. The company has fixed expenses of $15,000 per month. In August, the company sold 240 cubic yards of Grade A mulch.
- Calculate the contribution margin per unit for Grade A mulch.
- Calculate the contribution margin ratio of the Grade A mulch.
- Prepare a contribution margin income statement for the month of August.
(Figure)A company manufactures and sells blades that are used in riding lawnmowers. The 18-inch blade sells for $15 and has per-unit variable costs of $4 associated with its production. The company has fixed expenses of $85,000 per month. In January, the company sold 12,000 of the 18-inch blades.
- Calculate the contribution margin per unit for the 18-inch blade.
- Calculate the contribution margin ratio of the 18-inch blade.
- Prepare a contribution margin income statement for the month of January.
(Figure)Mariana Manufacturing and Bellow Brothers compete in the same industry and in all respects their products are virtually identical. However, most of Mariana’s costs are fixed while Bellow’s costs are primarily variable. If sales increase for both companies, which will realize the greatest increase in profits? Why?
Glossary
- contribution margin ratio
- percentage of a unit’s selling price that exceeds total unit variable costs
- contribution margin
- amount by which a product’s selling price exceeds its total variable cost per unit
- relevant range
- quantitative range of units that can be produced based on the company’s current productive assets; for example, if a company has sufficient fixed assets to produce up to 10,000 units of product, the relevant range would be between 0 and 10,000 units
- total contribution margin
- amount by which total sales exceed total variable costs
