
Examine the Efficiency of Inventory Management Using Financial Ratios
Mitchell Franklin; Patty Graybeal; and Dixon Cooper
Inventory is a large investment for many companies so it is important that this asset be managed wisely. Too little inventory means lost sales opportunities, whereas too much inventory means unproductive investment of resources as well as extra costs related to storage, care, and protection of the inventory. Ratio analysis is used to measure how well management is doing at maintaining just the right amount of inventory for the needs of their particular business.
Once calculated, these ratios should be compared to previous years’ ratios for the company, direct competitors’ ratios, industry ratios, and other industries’ ratios. The insights gained from the ratio analysis should be used to augment analysis of the general strength and stability of the company, with the full data available in the annual report, including financial statements and notes to the financial statement.
Fundamentals of Inventory Ratios
Inventory ratio analysis relates to how well the inventory is being managed. Two ratios can be used to assess how efficiently management is handling inventory. The first ratio, inventory turnover, measures the number of times an average quantity of inventory was bought and sold during the period. The second ratio, number of days’ sales in inventory, measures how many days it takes to complete the cycle between buying and selling inventory.
Calculating and Interpreting the Inventory Turnover Ratio
Inventory turnover ratio is computed by dividing cost of goods sold by average inventory. The ratio measures the number of times inventory rotated through the sales cycle for the period. Let’s review how this works for The Spy Who Loves You dataset. This example scenario relates to the FIFO periodic cost allocation, using those previously calculated values for year 1 cost of goods sold, beginning inventory, and ending inventory, and assuming a 10% increase in inventory activity for year 2, as shown in (Figure).
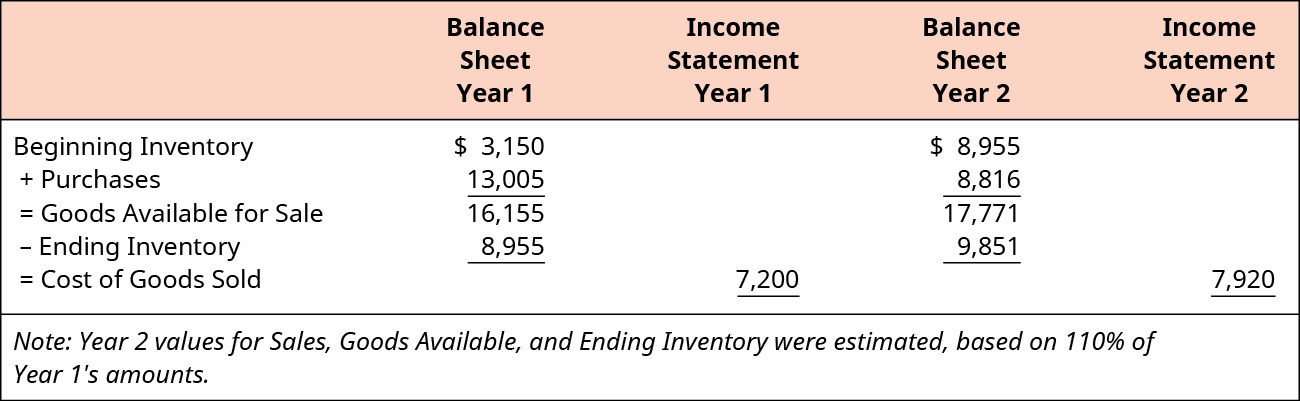
The inventory turnover ratio is calculated by dividing cost of goods sold by average inventory. The result for the Spy Who Loves You Company indicates that the inventory cycled through the sales cycle 1.19 times in year 1, and 0.84 times in year 2.
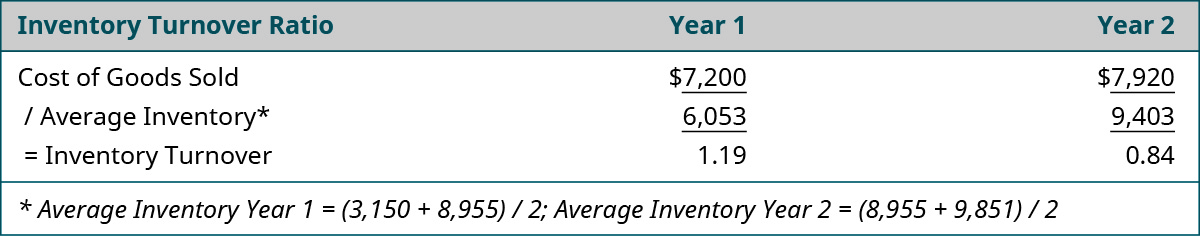
The fact that the year 2 inventory turnover ratio is lower than the year 1 ratio is not a positive trend. This result would alert management that the inventory balance might be too high to be practical for this volume of sales. Comparison should also be made to competitor and industry ratios, while consideration should also be given to other factors affecting the company’s financial health as well as the strength of the overall market economy.
Calculating and Interpreting the Days’ Sales in Inventory Ratio
Number of days’ sales in inventory ratio is computed by dividing average merchandise inventory by the average daily cost of goods sold. The ratio measures the number of days it would take to clear the remaining inventory. Let’s review this using The Spy Who Loves You dataset. The example scenario relates to the FIFO periodic cost allocation, using those previously calculated values for year 1 cost of goods sold, beginning inventory, and ending inventory, and assuming a 10% increase in inventory activity for year 2, as in (Figure).
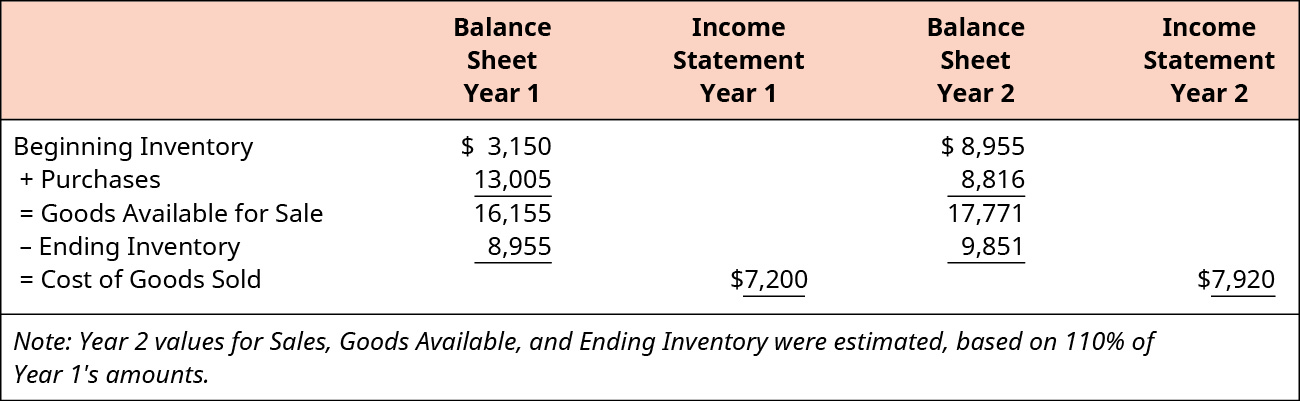
The number of days’ sales in inventory ratio is calculated by dividing average inventory by average daily cost of goods sold. The result for the Spy Who Loves You indicates that it would take about 307 days to clear the average inventory held in year 1 and about 433 days to clear the average inventory held in year 2.
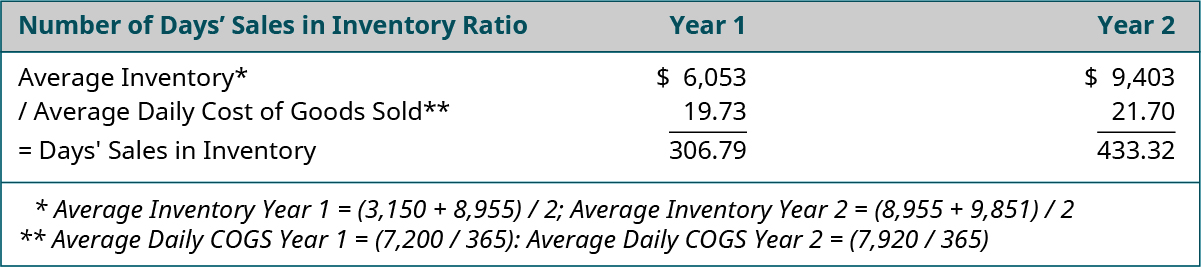
Year 2’s number of days’ sales in inventory ratio increased over year 1’s ratio results, indicating an unfavorable change. This result would alert management that it is taking much too long to sell the inventory, so reduction in the inventory balance might be appropriate, or as an alternative, increased sales efforts could turn the ratio toward a more positive trend. This ratio is useful to identify cases of obsolescence, which is especially prevalent in an evolving market, such as the technology sector of the economy. As with any ratio, comparison should also be made to competitor and industry ratios, while consideration should also be given to other factors affecting the company’s financial health, as well as to the strength of the overall market economy.
Key Concepts and Summary
- Inventory ratio analysis tools help management to identify inefficient management practices and pinpoint troublesome scenarios within their inventory operations processes.
- The inventory turnover ratio measures how fast the inventory sells, which can be useful for inter-period comparison as well as comparisons with competitor firms.
- The number of days’ sales in inventory ratio indicates how long it takes for inventory to be sold, on average, which can help the firm identify instances of too much or too little inventory, indicating such cases as product obsolescence or excess stocking, or the reverse scenario: insufficient inventory, which could result in customer dissatisfaction and lost sales.
(Figure)Which of the following indicates a positive trend for inventory management?
- increasing number of days’ sales in inventory ratio
- increasing inventory turnover ratio
- increasing cost of goods sold
- increasing sales revenue
(Figure)Explain the difference between the flow of cost and the flow of goods as it relates to inventory.
(Figure)What insights can be gained from inventory ratio analysis, such as inventory turnover ratio and number of days’ sales in inventory ratio?
The inventory turnover ratio reveals the liquidity of the inventory by highlighting how many times during the year the entire inventory cycle could be rotated, based on the cost of the inventory sold, compared to the average cost of the unsold inventory. Days’ sales in inventory reveals how many days it typically takes to turn inventory around, from date of purchase to date of sale.
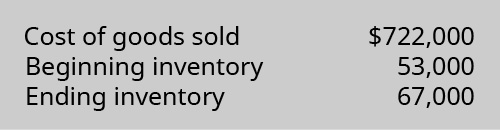
(Figure)Compute Altoona Company’s (a) inventory turnover ratio and (b) number of days’ sales in inventory ratio, using the following information.
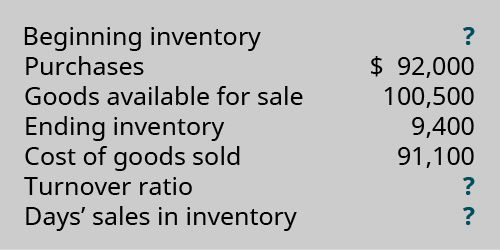
(Figure)Complete the missing pieces of McCarthy Company’s inventory calculations and ratios.
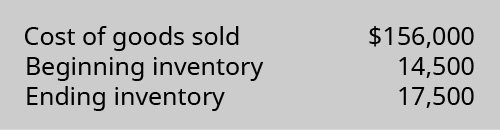
(Figure)Compute Westtown Company’s (A) inventory turnover ratio and (B) number of days’ sales in inventory ratio, using the following information.
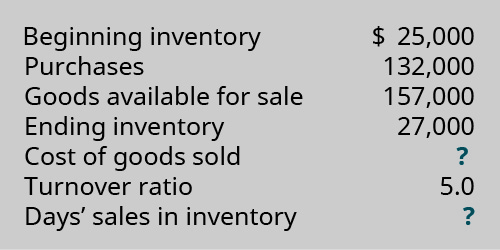
(Figure)Complete the missing pieces of Delgado Company’s inventory calculations and ratios.
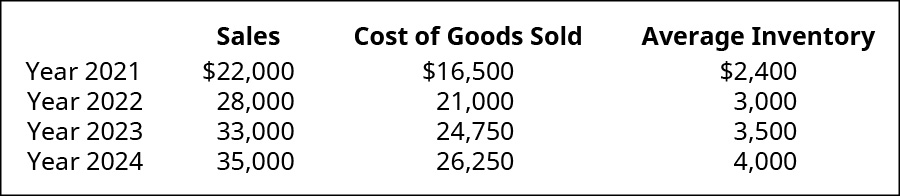
(Figure)Use the following information relating to Shana Company to calculate the inventory turnover ratio and the number of days’ sales in inventory ratio.
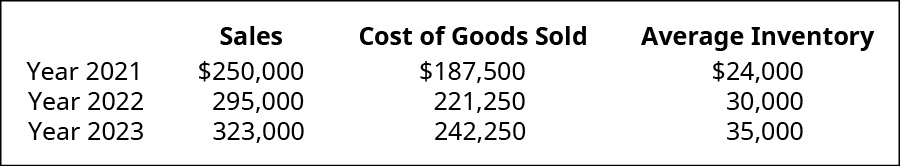
(Figure)Use the following information relating to Clover Company to calculate the inventory turnover ratio, gross margin, and the number of days’ sales in inventory ratio, for years 2022 and 2023.
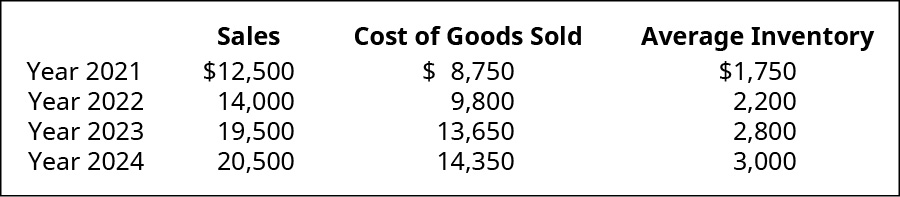
(Figure)Use the following information relating to Singh Company to calculate the inventory turnover ratio and the number of days’ sales in inventory ratio.
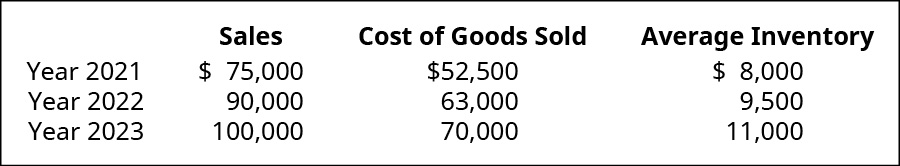
(Figure)Use the following information relating to Medinas Company to calculate the inventory turnover ratio, gross margin, and the number of days’ sales in inventory ratio, for years 2022 and 2023.
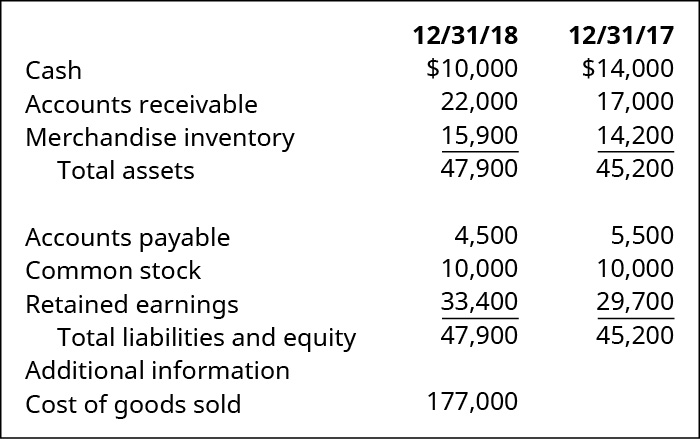
(Figure)Use a spreadsheet and the following excerpts from Hileah Company’s financial information to build a template that automatically calculates (A) inventory turnover and (B) number of days’ sales in inventory, for the year 2018.
(Figure)Search the SEC website (https://www.sec.gov/edgar/searchedgar/companysearch.html) and locate the latest Form 10-K for a company you would like to analyze. Submit a short memo that states the following:
- The name and ticker symbol of the company you have chosen.
- Describe two items relating to inventory from the company’s notes to financial statements:
- one familiar item that you expected to be in the notes to the financial statement, based on this chapter’s coverage; and
- one unfamiliar item that you did not expect to be in the notes to the financial statements.
- Provide the weblink to the company’s Form 10-K, to allow accurate verification of your answers.
Glossary
- inventory turnover ratio
- computed by dividing cost of goods sold by average inventory; measures number of times inventory rotated through the sales cycle for the period
- number of days’ sales in inventory ratio
- computed by dividing average merchandise inventory by average daily cost of goods sold; measures number of days it would take to clear remaining inventory
