
Describe and Demonstrate the Basic Inventory Valuation Methods and Their Cost Flow Assumptions
Mitchell Franklin; Patty Graybeal; and Dixon Cooper
Accounting for inventory is a critical function of management. Inventory accounting is significantly complicated by the fact that it is an ongoing process of constant change, in part because (1) most companies offer a large variety of products for sale, (2) product purchases occur at irregular times, (3) products are acquired for differing prices, and (4) inventory acquisitions are based on sales projections, which are always uncertain and often sporadic. Merchandising companies must meticulously account for every individual product that they sell, equipping them with essential information, for decisions such as these:
- What is the quantity of each product that is available to customers?
- When should inventory of each product item be replenished and at what quantity?
- How much should the company charge customers for each product to cover all costs plus profit margin?
- How much of the inventory cost should be allocated toward the units sold (cost of goods sold) during the period?
- How much of the inventory cost should be allocated toward the remaining units (ending inventory) at the end of the period?
- Is each product moving robustly or have some individual inventory items’ activity decreased?
- Are some inventory items obsolete?
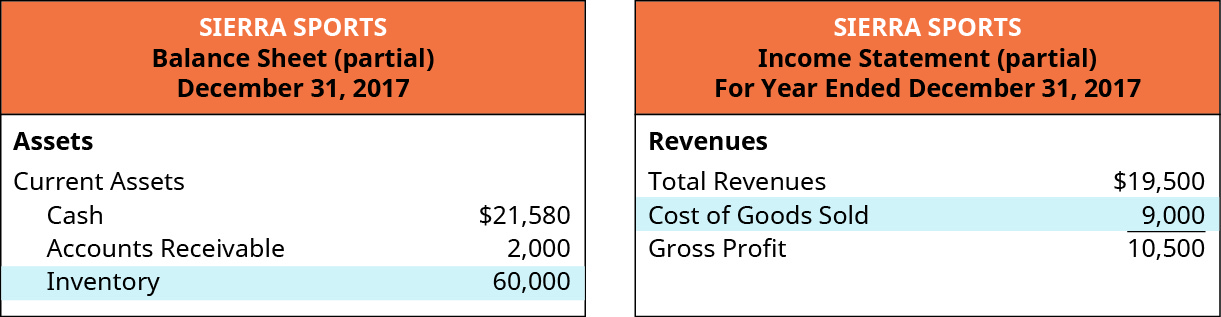
The company’s financial statements report the combined cost of all items sold as an offset to the proceeds from those sales, producing the net number referred to as gross margin (or gross profit). This is presented in the first part of the results of operations for the period on the multi-step income statement. The unsold inventory at period end is an asset to the company and is therefore included in the company’s financial statements, on the balance sheet, as shown in (Figure). The total cost of all the inventory that remains at period end, reported as merchandise inventory on the balance sheet, plus the total cost of the inventory that was sold or otherwise removed (through shrinkage, theft, or other loss), reported as cost of goods sold on the income statement (see (Figure)), represent the entirety of the inventory that the company had to work with during the period, or goods available for sale.
Fundamentals of Inventory
Although our discussion will consider inventory issues from the perspective of a retail company, using a resale or merchandising operation, inventory accounting also encompasses recording and reporting of manufacturing operations. In the manufacturing environment, there would be separate inventory calculations for the various process levels of inventory, such as raw materials, work in process, and finished goods. The manufacturer’s finished goods inventory is equivalent to the merchandiser’s inventory account in that it includes finished goods that are available for sale.
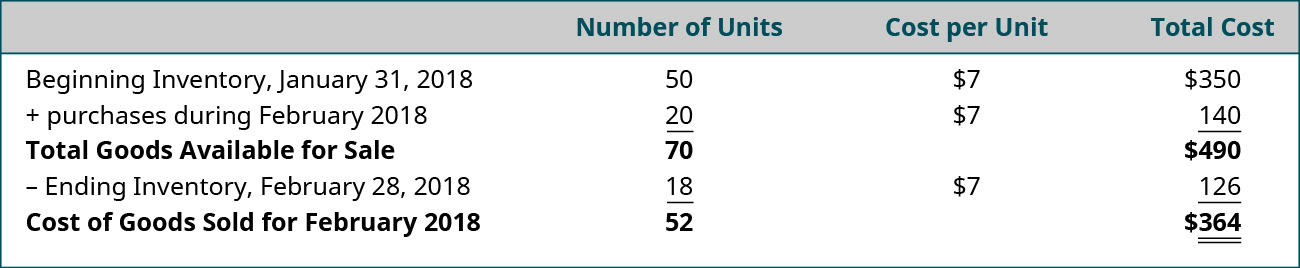
In merchandising companies, inventory is a company asset that includes beginning inventory plus purchases, which include all additions to inventory during the period. Every time the company sells products to customers, they dispose of a portion of the company’s inventory asset. Goods available for sale refers to the total cost of all inventory that the company had on hand at any time during the period, including beginning inventory and all inventory purchases. These goods were normally either sold to customers during the period (occasionally lost due to spoilage, theft, damage, or other types of shrinkages) and thus reported as cost of goods sold, an expense account on the income statement, or these goods are still in inventory at the end of the period and reported as ending merchandise inventory, an asset account on the balance sheet. As an example, assume that Harry’s Auto Parts Store sells oil filters. Suppose that at the end of January 31, 2018, they had 50 oil filters on hand at a cost of $7 per unit. This means that at the beginning of February, they had 50 units in inventory at a total cost of $350 (50 × $7). During the month, they purchased 20 filters at a cost of $7, for a total cost of $140 (20 × $7). At the end of the month, there were 18 units left in inventory. Therefore, during the month of February, they sold 52 units. (Figure) illustrates how to calculate the goods available for sale and the cost of goods sold.
Inventory costing is accomplished by one of four specific costing methods: (1) specific identification, (2) first-in, first-out, (3) last-in, first-out, and (4) weighted-average cost methods. All four methods are techniques that allow management to distribute the costs of inventory in a logical and consistent manner, to facilitate matching of costs to offset the related revenue item that is recognized during the period, in accordance with GAAP expense recognition and matching concepts. Note that a company’s cost allocation process represents management’s chosen method for expensing product costs, based strictly on estimates of the flow of inventory costs, which is unrelated to the actual flow of the physical inventory. Use of a cost allocation strategy eliminates the need for often cost-prohibitive individual tracking of costs of each specific inventory item, for which purchase prices may vary greatly. In this chapter, you will be provided with some background concepts and explanations of terms associated with inventory as well as a basic demonstration of each of the four allocation methods, and then further delineation of the application and nuances of the costing methods.
A critical issue for inventory accounting is the frequency for which inventory values are updated. There are two primary methods used to account for inventory balance timing changes: the periodic inventory method and the perpetual inventory method. These two methods were addressed in depth in Merchandising Transactions).
Periodic Inventory Method
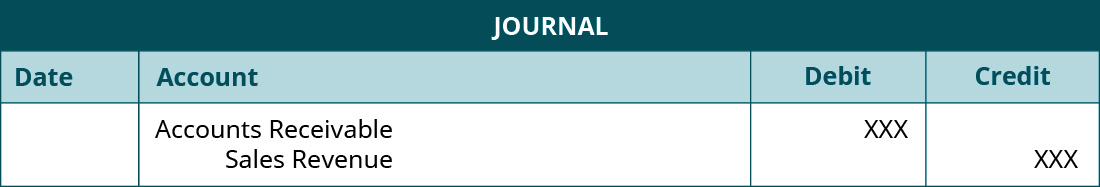
A periodic inventory system updates the inventory balances at the end of the reporting period, typically the end of a month, quarter, or year. At that point, a journal entry is made to adjust the merchandise inventory asset balance to agree with the physical count of inventory, with the corresponding adjustment to the expense account, cost of goods sold. This adjustment shifts the costs of all inventory items that are no longer held by the company to the income statement, where the costs offset the revenue from inventory sales, as reflected by the gross margin. As sales transactions occur throughout the period, the periodic system requires that only the sales entry be recorded because costs will only be updated during end-of-period adjustments when financial statements are prepared. However, any additional goods for sale acquired during the month are recorded as purchases. Following are examples of typical journal entries for periodic transactions. The first is an example entry for an inventory sales transaction when using periodic inventory, and the second records the purchase of additional inventory when using the periodic method. Note: Periodic requires no corresponding cost entry at the time of sale, since the inventory is adjusted only at period end.
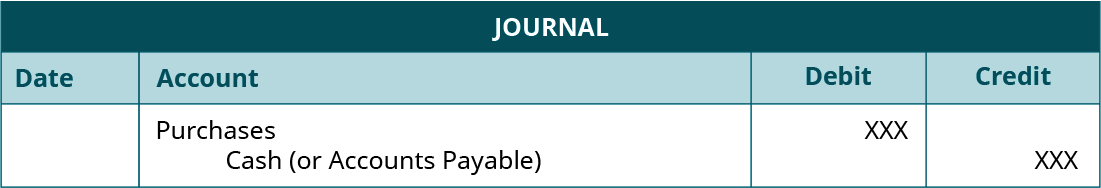
A purchase of inventory for sale by a company under the periodic inventory method would necessitate the following journal entry. (This is discussed in more depth in Merchandising Transactions.)
Perpetual Inventory Method
A perpetual inventory system updates the inventory account balance on an ongoing basis, at the time of each individual sale. This is normally accomplished by use of auto-ID technology, such as optical-scan barcode or radio frequency identification (RFIF) labels. As transactions occur, the perpetual system requires that every sale is recorded with two entries, first recording the sales transaction as an increase to Accounts Receivable and a decrease to Sales Revenue, and then recording the cost associated with the sale as an increase to Cost of Goods Sold and a decrease to Merchandise Inventory. The journal entries made at the time of sale immediately shift the costs relating to the goods being sold from the merchandise inventory account on the balance sheet to the cost of goods sold account on the income statement. Little or no adjustment is needed to inventory at period end because changes in the inventory balances are recorded as both the sales and purchase transactions occur. Any necessary adjustments to the ending inventory account balances would typically be caused by one of the types of shrinkage you’ve learned about. These are example entries for an inventory sales transaction when using perpetual inventory updating:
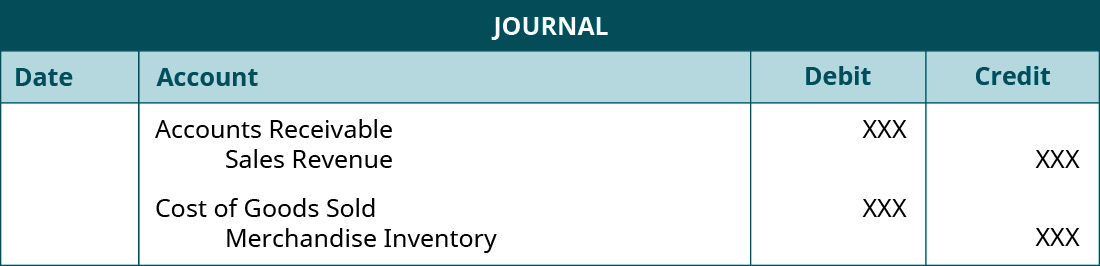
A purchase of inventory for sale by a company under the perpetual inventory method would necessitate the following journal entry. (Greater detail is provided in Merchandising Transactions.)

As previously discussed, Gearhead Outfitters is a retail chain selling outdoor gear and accessories. As such, the company is faced with many possible questions related to inventory. How much inventory should be carried? What products are the most profitable? Which products have the most sales? Which products are obsolete? What timeframe should the company allow for inventory to be replenished? Which products are the most in demand at each location?
In addition to questions related to type, volume, obsolescence, and lead time, there are many issues related to accounting for inventory and the flow of goods. As one of the biggest assets of the company, the way inventory is tracked can have an effect on profit. Which method of accounting—first-in first-out, last-in first out, specific identification, weighted average— provides the most accurate reflection of inventory and cost of goods sold is important in determining gross profit and net income. The method selected affects profits, taxes, and can even change the opinion of potential lenders concerning the financial strength of the company. In choosing a method of accounting for inventory, management should consider many factors, including the accurate reflection of costs, taxes on profits, decision-making about purchases, and what effect a point-of-sale (POS) system may have on tracking inventory.
Gearhead exists to provide a positive shopping experience for its customers. Offering a clear picture of its goods, and maintaining an appealing, timely supply at competitive prices is one way to keep the shopping experience positive. Thus, accounting for inventory plays an instrumental role in management’s ability to successfully run a company and deliver the company’s promise to customers.
Data for Demonstration of the Four Basic Inventory Valuation Methods
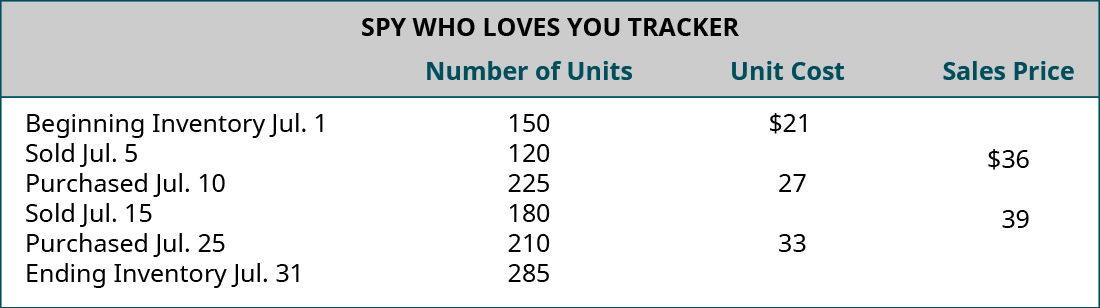
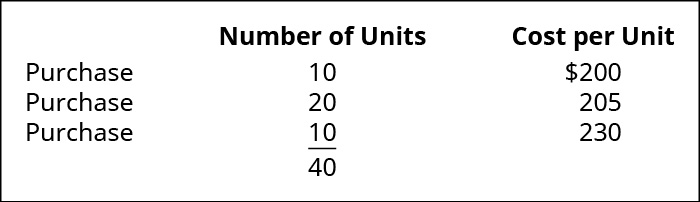
The following dataset will be used to demonstrate the application and analysis of the four methods of inventory accounting.
Company: Spy Who Loves You Corporation
Product: Global Positioning System (GPS) Tracking Device
Description: This product is an economical real-time GPS tracking device, designed for individuals who wish to monitor others’ whereabouts. It is marketed to parents of middle school and high school students as a safety measure. Parents benefit by being apprised of the child’s location, and the student benefits by not having to constantly check in with parents. Demand for the product has spiked during the current fiscal period, while supply is limited, causing the selling price to escalate rapidly.
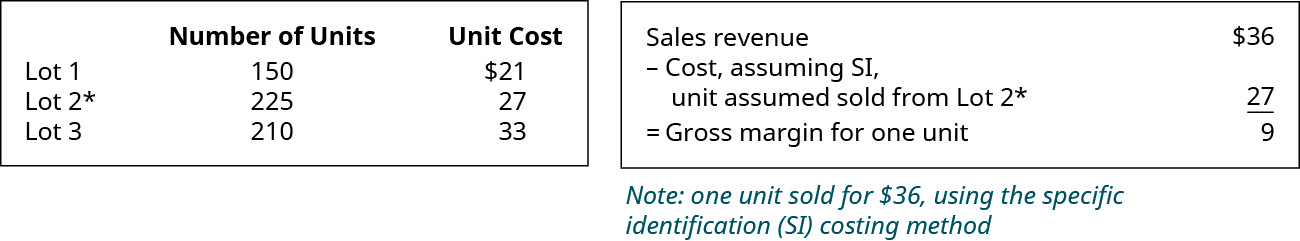
Specific Identification Method
The specific identification method refers to tracking the actual cost of the item being sold and is generally used only on expensive items that are highly customized (such as tracking detailed costs for each individual car in automobiles sales) or inherently distinctive (such as tracking origin and cost for each unique stone in diamond sales). This method is too cumbersome for goods of large quantity, especially if there are not significant feature differences in the various inventory items of each product type. However, for purposes of this demonstration, assume that the company sold one specific identifiable unit, which was purchased in the second lot of products, at a cost of $27.
Three separate lots of goods are purchased:
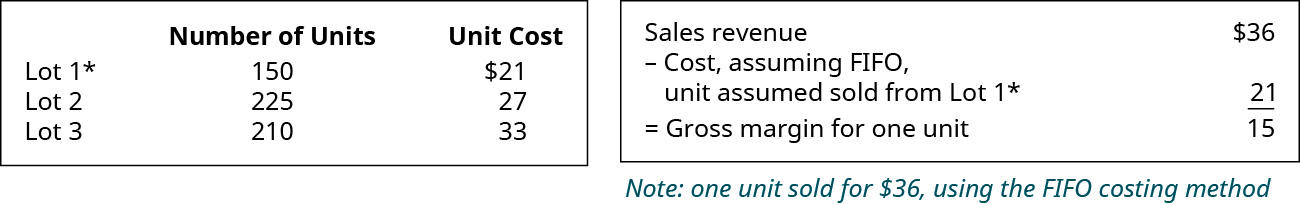
First-in, First-out (FIFO) Method
The first-in, first-out method (FIFO) records costs relating to a sale as if the earliest purchased item would be sold first. However, the physical flow of the units sold under both the periodic and perpetual methods would be the same. Due to the mechanics of the determination of costs of goods sold under the perpetual method, based on the timing of additional purchases of inventory during the accounting period, it is possible that the costs of goods sold might be slightly different for an accounting period. Since FIFO assumes that the first items purchased are sold first, the latest acquisitions would be the items that remain in inventory at the end of the period and would constitute ending inventory.
Three separate lots of goods are purchased:
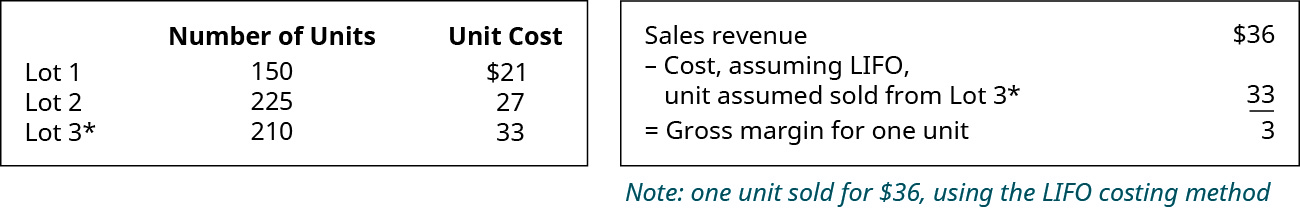
Last-in, First-out (LIFO) Method
The last-in, first out method (LIFO) records costs relating to a sale as if the latest purchased item would be sold first. As a result, the earliest acquisitions would be the items that remain in inventory at the end of the period.
Three separate lots of goods are purchased:
For many companies, inventory is a significant portion of the company’s assets. In 2018, the inventory of Walmart, the world’s largest international retailer, was 70% of current assets and 21% of total assets. Because inventory also affects income as it is sold through the cost of goods sold account, inventory plays a significant role in the analysis and evaluation of many companies. Ending inventory affects both the balance sheet and the income statement. As you’ve learned, the ending inventory balance is reflected as a current asset on the balance sheet and the ending inventory balance is used in the calculation of costs of goods sold. Understanding how companies report inventory under US GAAP versus under IFRS is important when comparing companies reporting under the two methods, particularly because of a significant difference between the two methods.
Similarities
- When inventory is purchased, it is accounted for at historical cost and then evaluated at each balance sheet date to adjust to the lower of cost or net realizable value.
- Both IFRS and US GAAP allow FIFO and weighted-average cost flow assumptions as well as specific identification where appropriate and applicable.
Differences
- IFRS does not permit the use of LIFO. This is a major difference between US GAAP and IFRS. The AICPA estimates that roughly 35–40% of all US companies use LIFO, and in some industries, such as oil and gas, the use of LIFO is more prevalent. Because LIFO generates lower taxable income during times of rising prices, it is estimated that eliminating LIFO would generate an estimated $102 billion in tax revenues in the US for the period 2017–2026. In creating IFRS, the IASB chose to eliminate LIFO, arguing that FIFO more closely matches the flow of goods. In the US, FASB believes the choice between LIFO and FIFO is a business model decision that should be left up to each company. In addition, there was significant pressure by some companies and industries to retain LIFO because of the significant tax liability that would arise for many companies from the elimination of LIFO.
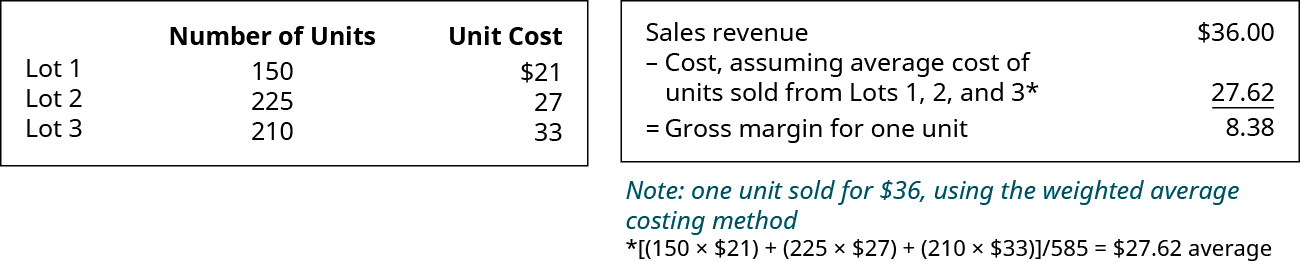
Weighted-Average Cost Method
The weighted-average cost method (sometimes referred to as the average cost method) requires a calculation of the average cost of all units of each particular inventory items. The average is obtained by multiplying the number of units by the cost paid per unit for each lot of goods, then adding the calculated total value of all lots together, and finally dividing the total cost by the total number of units for that product. As a caveat relating to the average cost method, note that a new average cost must be calculated after every change in inventory to reassess the per-unit weighted-average value of the goods. This laborious requirement might make use of the average method cost-prohibitive.
Three separate lots of goods are purchased:
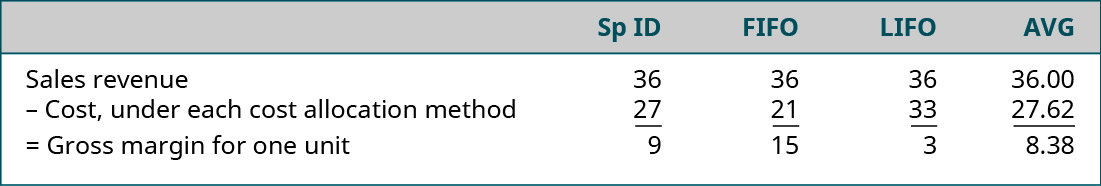
Comparing the various costing methods for the sale of one unit in this simple example reveals a significant difference that the choice of cost allocation method can make. Note that the sales price is not affected by the cost assumptions; only the cost amount varies, depending on which method is chosen. (Figure) depicts the different outcomes that the four methods produced.
Once the methods of costing are determined for the company, that methodology would typically be applied repeatedly over the remainder of the company’s history to accomplish the generally accepted accounting principle of consistency from one period to another. It is possible to change methods if the company finds that a different method more accurately reflects results of operations, but the change requires disclosure in the company’s notes to the financial statements, which alerts financial statement users of the impact of the change in methodology. Also, it is important to realize that although the Internal Revenue Service generally allows differing methods of accounting treatment for tax purposes than for financial statement purposes, an exception exists that prohibits the use of LIFO inventory costing on the company tax return unless LIFO is also used for the financial statement costing calculations.
Inventory fraud can be used to book false revenue or to increase the amount of assets to obtain additional lending from a bank or other sources. In the typical chain of accounting events, inventory ultimately becomes an expense item known as cost of goods sold.1 In a manipulated accounting system, a trail of fraudulent transactions can point to accounting misrepresentation in the sales cycle, which may include
- recording fictitious and nonexistent inventory,
- manipulation of inventory counts during a facility audit,
- recording of sales but no recording of purchases, and/or
- fraudulent inventory capitalization,
to list a few.2 All these elaborate schemes have the same goal: to improperly manipulate inventory values to support the creation of a fraudulent financial statement. Accountants have an ethical, moral, and legal duty to not commit accounting and financial statement fraud. Auditors have a duty to look for such inventory fraud.
Auditors follow the Statement on Auditing Standards (SAS) No. 99 and AU Section 316 Consideration of Fraud in a Financial Statement Audit when auditing a company’s books. Auditors are outside accountants hired to “obtain reasonable assurance about whether the financial statements are free of material misstatement, whether caused by error or fraud.”3 Ultimately, an auditor will prepare an audit report based on the testing of the balances in a company’s books, and a review of the company’s accounting system. The auditor is to perform “procedures at locations on a surprise or unannounced basis, for example, observing inventory on unexpected dates or at unexpected locations or counting cash on a surprise basis.”4 Such testing of a company’s inventory system is used to catch accounting fraud. It is the responsibility of the accountant to present accurate accounting records to the auditor, and for the auditor to create auditing procedures that reasonably ensure that the inventory balances are free of material misstatements in the accounting balances.
Additional Inventory Issues
Various other issues that affect inventory accounting include consignment sales, transportation and ownership issues, inventory estimation tools, and the effects of inflationary versus deflationary cycles on various methods.
Consignment
Consigned goods refer to merchandise inventory that belongs to a third party but which is displayed for sale by the company. These goods are not owned by the company and thus must not be included on the company’s balance sheet nor be used in the company’s inventory calculations. The company’s profit relating to consigned goods is normally limited to a percentage of the sales proceeds at the time of sale.
For example, assume that you sell your office and your current furniture doesn’t match your new building. One way to dispose of the furniture would be to have a consignment shop sell it. The shop would keep a percentage of the sales revenue and pay you the remaining balance. Assume in this example that the shop will keep one-third of the sales proceeds and pay you the remaining two-thirds balance. If the furniture sells for $15,000, you would receive $10,000 and the shop would keep the remaining $5,000 as its sales commission. A key point to remember is that until the inventory, in this case your office furniture, is sold, you still own it, and it is reported as an asset on your balance sheet and not an asset for the consignment shop. After the sale, the buyer is the owner, so the consignment shop is never the property’s owner.
Free on Board (FOB) Shipping and Destination
Transportation costs are commonly assigned to either the buyer or the seller based on the free on board (FOB) terms, as the terms relate to the seller. Transportation costs are part of the responsibilities of the owner of the product, so determining the owner at the shipping point identifies who should pay for the shipping costs. The seller’s responsibility and ownership of the goods ends at the point that is listed after the FOB designation. Thus, FOB shipping point means that the seller transfers title and responsibility to the buyer at the shipping point, so the buyer would owe the shipping costs. The purchased goods would be recorded on the buyer’s balance sheet at this point.
Similarly, FOB destination means the seller transfers title and responsibility to the buyer at the destination, so the seller would owe the shipping costs. Ownership of the product is the trigger that mandates that the asset be included on the company’s balance sheet. In summary, the goods belong to the seller until they transition to the location following the term FOB, making the seller responsible for everything about the goods to that point, including recording purchased goods on the balance sheet . If something happens to damage or destroy the goods before they reach the FOB location, the seller would be required to replace the product or reverse the sales transaction.
Lower-of-Cost-or-Market (LCM)
Reporting inventory values on the balance sheet using the accounting concept of conservatism (which discourages overstatement of net assets and net income) requires inventory to be calculated and adjusted to a value that is the lower of the cost calculated using the company’s chosen valuation method or the market value based on the market or replacement value of the inventory items. Thus, if traditional cost calculations produce inventory values that are overstated, the lower-of-cost-or-market (LCM) concept requires that the balance in the inventory account should be decreased to the more conservative replacement value rather than be overstated on the balance sheet.
Estimating Inventory Costs: Gross Profit Method and Retail Inventory Method
Sometimes companies have a need to estimate inventory values. These estimates could be needed for interim reports, when physical counts are not taken. The need could be result from a natural disaster that destroys part or all of the inventory or from an error that causes inventory counts to be compromised or omitted. Some specific industries (such as select retail businesses) also regularly use these estimation tools to determine cost of goods sold. Although the method is predictable and simple, it is also less accurate since it is based on estimates rather than actual cost figures.
The gross profit method is used to estimate inventory values by applying a standard gross profit percentage to the company’s sales totals when a physical count is not possible. The resulting gross profit can then be subtracted from sales, leaving an estimated cost of goods sold. Then the ending inventory can be calculated by subtracting cost of goods sold from the total goods available for sale. Likewise, the retail inventory method estimates the cost of goods sold, much like the gross profit method does, but uses the retail value of the portions of inventory rather than the cost figures used in the gross profit method.
Inflationary Versus Deflationary Cycles
As prices rise (inflationary times), FIFO ending inventory account balances grow larger even when inventory unit counts are constant, while the income statement reflects lower cost of goods sold than the current prices for those goods, which produces higher profits than if the goods were costed with current inventory prices. Conversely, when prices fall (deflationary times), FIFO ending inventory account balances decrease and the income statement reflects higher cost of goods sold and lower profits than if goods were costed at current inventory prices. The effect of inflationary and deflationary cycles on LIFO inventory valuation are the exact opposite of their effects on FIFO inventory valuation.
Accounting Coach does a great job in explaining inventory issues (and so many other accounting topics too): Learn more about inventory and cost of goods sold on their website.
Suppose you are the assistant controller for a retail establishment that is an independent bookseller. The company uses manual, periodic inventory updating, using physical counts at year end, and the FIFO method for inventory costing. How would you approach the subject of whether the company should consider switching to computerized perpetual inventory updating? Can you present a persuasive argument for the benefits of perpetual? Explain.
Key Concepts and Summary
- The total cost of goods available for sale is a combination of the beginning inventory plus new inventory purchases. These costs relating to goods available for sale are included in the ending inventory, reported on the balance sheet, or become part of the cost of goods sold reported on the income statement.
- Merchandise inventory is maintained using either the periodic or the perpetual updating system. Periodic updating is performed at the end of the period only, whereas perpetual updating is an ongoing activity that maintains inventory records that are approximately equal to the actual inventory on hand at any time.
- There are four basic inventory cost flow allocation methods, which are alternative ways to estimate the cost of the units that are sold and the value of the ending inventory. The costing methods are not indicative of the flow of the goods, which often moves in a different order than the flow of the costs.
- Utilizing different cost allocation options results in marked differences in reported cost of goods sold, net income, and inventory balances.
(Figure)If a company has four lots of products for sale, purchase 1 (earliest) for $17, purchase 2 (middle) for $15, purchase 3 (middle) for $12, and purchase 4 (latest) for $14, which cost would be assumed to be sold first using LIFO costing?
- $17
- $15
- $12
- $14
D
(Figure)If a company has three lots of products for sale, purchase 1 (earliest) for $17, purchase 2 (middle) for $15, purchase 3 (latest) for $12, which of the following statements is true?
- This is an inflationary cost pattern.
- This is a deflationary cost pattern.
- The next purchase will cost less than $12.
- None of these statements can be verified.
(Figure)When inventory items are highly specialized, the best inventory costing method is ________.
- specific identification
- first-in, first-out
- last-in, first-out
- weighted average
A
(Figure)If goods are shipped FOB destination, which of the following is true?
- Title to the goods will transfer as soon as the goods are shipped.
- FOB indicates that a price reduction has been applied to the order.
- The seller must pay the shipping.
- The seller and the buyer will each pay 50% of the cost.
(Figure)On which financial statement would the merchandise inventory account appear?
- balance sheet
- income statement
- both balance sheet and income statement
- neither balance sheet nor income statement
A
(Figure)When would using the FIFO inventory costing method produce higher inventory account balances than the LIFO method would?
- inflationary times
- deflationary times
- always
- never
(Figure)Which accounting rule serves as the primary basis for the lower-of-cost-or-market methodology for inventory valuation?
- conservatism
- consistency
- optimism
- pessimism
A
(Figure)Which type or types of inventory timing system (periodic or perpetual) requires the user to record two journal entries every time a sale is made.
- periodic
- perpetual
- both periodic and perpetual
- neither periodic nor perpetual
(Figure)What is meant by the term gross margin?
Gross margin refers to the net profit from sale of goods. It is calculated by subtracting cost of goods sold from sales revenue.
(Figure)Can a business change from one inventory costing method to another any time they wish? Explain.
(Figure)Why do consignment arrangements present a challenge in inventory management? Explain.
Consigned goods are owned by the consignor, but the goods are physically present in the business of the consignee. Care must be taken not to count goods held on consignment in the company’s physical inventory tally.
(Figure)Explain the difference between the terms FOB destination and FOB shipping point.
(Figure)When would a company use the specific identification method of inventory cost allocation?
Specific identification works best for highly differentiated goods, large ticket items, customization, and small lot sizes. In all these cases, it is reasonably easy to keep track of the actual cost of each item, to be used to offset the sales price, when the goods are sold.
(Figure)Explain why a company might want to utilize the gross profit method or the retail inventory method for inventory valuation.
(Figure)Describe the goal of the lower-of-cost-or-market concept.
LCM sets out to record a conservative value for inventory by ensuring that goods that have decreased in value since their purchase can be revalued to match their current replacement market value.
(Figure)Describe two separate and distinct ways to calculate goods available for sale.
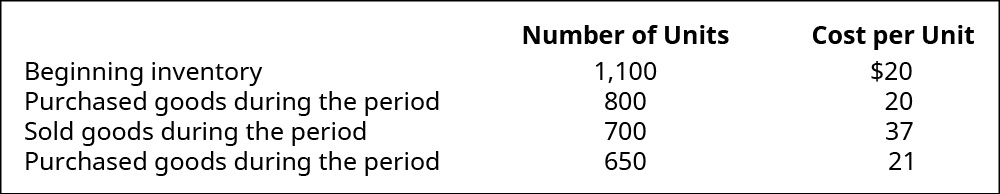
(Figure)Calculate the goods available for sale for Atlantis Company, in units and in dollar amounts, given the following facts about their inventory for the period:
(Figure)E Company accepts goods on consignment from R Company and also purchases goods from S Company during the current month. E Company plans to sell the merchandise to customers during the following month. In each of these independent situations, who owns the merchandise at the end of the current month and should therefore include it in their company’s ending inventory? Choose E, R, or S.
- Goods ordered from R, delivered and displayed on E’s showroom floor at the end of the current month.
- Goods ordered from S, in transit, with shipping terms FOB destination.
- Goods ordered from R, in transit, with no stated shipping terms.
- Goods ordered from S, delivered and displayed on E’s showroom floor at the end of the current month, with shipping terms FOB destination.
- Goods ordered from S, in transit, with shipping terms FOB shipping point.
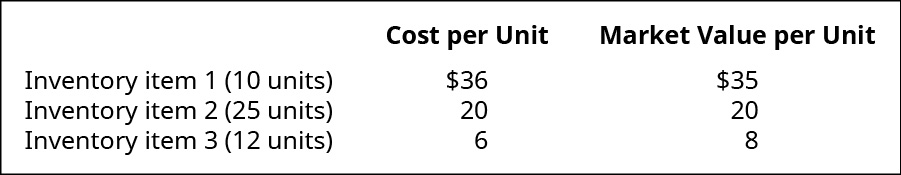
(Figure)The following information is taken from a company’s records. Applying the lower-of-cost-or-market approach, what is the correct value that should be reported on the balance sheet for the inventory?
(Figure)Calculate the goods available for sale for Soros Company, in units and in $ (dollar amounts), given the following facts about their inventory for the period.
(Figure)X Company accepts goods on consignment from C Company, and also purchases goods from P Company during the current month. X Company plans to sell the merchandise to customers during the following month. In each of these independent situations, who owns the merchandise at the end of the current month, and should therefore include it in their company’s ending inventory? Choose X, C, or P.
- Goods ordered from P, in transit, with shipping terms FOB destination.
- Goods ordered from P, in transit, with shipping terms FOB shipping point.
- Goods ordered from P, inventory in stock, held in storage until floor space is available.
- Goods ordered from C, inventory in stock, set aside for customer pickup and payments to finalize sale.
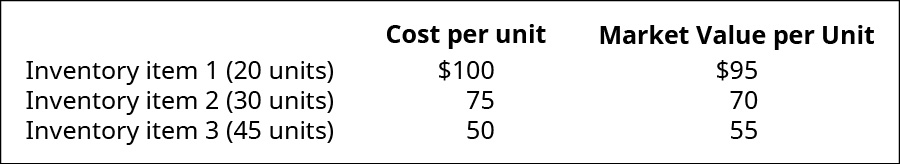
(Figure)Considering the following information, and applying the lower-of-cost-or-market approach, what is the correct value that should be reported on the balance sheet for the inventory?
(Figure)When prices are rising (inflation), which costing method would produce the highest value for gross margin? Choose between first-in, first-out (FIFO); last-in, first-out (LIFO); and weighted average (AVG).
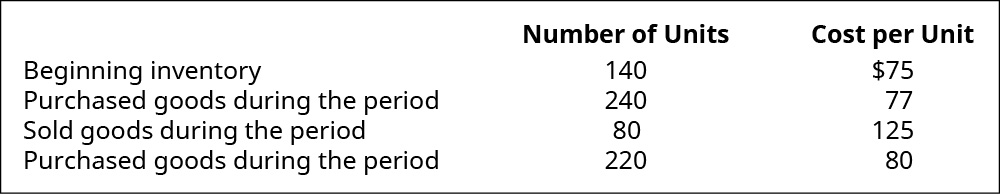
Evansville Company had the following transactions for the month.
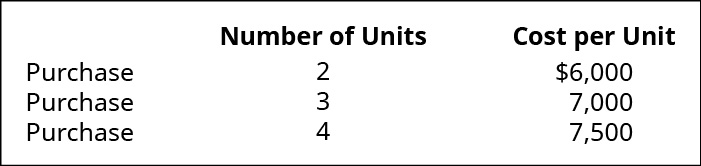
Calculate the gross margin for each of the following cost allocation methods, assuming A62 sold just one unit of these goods for $10,000. Provide your calculations.
- first-in, first-out (FIFO)
- last-in, first-out (LIFO)
- weighted average (AVG)
(Figure)When prices are falling (deflation), which costing method would produce the highest gross margin for the following? Choose first-in, first-out (FIFO); last-in, first-out (LIFO); or weighted average, assuming that B62 Company had the following transactions for the month.
Calculate the gross margin for each of the following cost allocation methods, assuming B62 sold just one unit of these goods for $400. Provide your calculations.
- first-in, first-out (FIFO)
- last-in, first-out (LIFO)
- weighted average (AVG)
(Figure)Search the SEC website (https://www.sec.gov/edgar/searchedgar/companysearch.html) and locate the latest Form 10-K for a company you would like to analyze. When you are choosing, make sure the company sells a product (has inventory on the balance sheet and cost of goods sold on the income statement). Submit a short memo that states the following:
- The name and ticker symbol of the company you have chosen.
- Answer the following questions from the company’s statement of Form 10-K financial statements:
- What amount of merchandise inventory does the company report on their balance sheet?
- What amount of cost of goods sold does the company report on their income statement?
Provide the weblink to the company’s Form 10-K, to allow accurate verification of your answers.
Footnotes
- 1 “Inventory Fraud: Knowledge Is Your First Line of Defense.” Weaver. Mar. 27, 2015. https://weaver.com/blog/inventory-fraud-knowledge-your-first-line-defense
- 2 Wells, Joseph T. “Ghost Goods: How to Spot Phantom Inventory.” Journal of Accountancy. June 1, 2001. https://www.journalofaccountancy.com/issues/2001/jun/ghostgoodshowtospotphantominventory.html
- 3 American Institute of Certified Public Accountants (AICPA). Consideration of Fraud in a Financial Statement Audit (AU Section 316). https://www.aicpa.org/Research/Standards/AuditAttest/DownloadableDocuments/AU-00316.pdf
- 4 American Institute of Certified Public Accountants (AICPA). Consideration of Fraud in a Financial Statement Audit (AU Section 316). https://www.aicpa.org/Research/Standards/AuditAttest/DownloadableDocuments/AU-00316.pdf
Glossary
- conservatism
- concept that if there is uncertainty in a potential financial estimate, a company should err on the side of caution and report the most conservative amount
- consignment
- arrangement whereby goods are available to sell by one party, but owned by another party, without transfer of ownership
- consistency principle
- accounting methods applied in a like manner, across multiple periods, allow for contrast and comparison between periods
- first-in, first-out method (FIFO)
- inventory cost allocation method that assumes the earliest acquired inventory items are the first to be sold
- FOB destination point
- transportation terms whereby the seller transfers ownership and financial responsibility at the time of delivery
- FOB shipping point
- transportation terms whereby the seller transfers ownership and financial responsibility at the time of shipment
- goods available for sale
- total of all inventory (beginning inventory plus purchased inventory); will either be sold this period or held in period-end inventory
- gross profit
- net profit from sale of goods; sales revenue minus cost of goods sold
- gross profit method
- inventory estimation tool that uses a company’s usual gross profit percentage, related to total sales revenue, to estimate the cost of the ending inventory
- last-in, first-out method (LIFO)
- inventory cost allocation method that assumes the latest acquired inventory items are the first to sell
- lower-of-cost-or-market (LCM)
- conservatism-based concept that mandates inventory be reported at the lower of the value of inventory reflected in the general ledger or replacement value
- merchandise inventory
- goods held for sale at a given point in the period
- periodic inventory system
- system that is updated at the end of the period, to match the physical count of goods on hand
- perpetual inventory system
- system that automatically updates and records the inventory account every time a sale or purchase of inventory occurs
- purchases
- new acquisitions of merchandise inventory during the period
- retail inventory method
- inventory estimation tool that uses a company’s usual gross profit percentage, related to total sales revenue, to estimate the retail value of the ending inventory, which can then be reduced to an estimated cost figure
- specific identification method
- inventory cost allocation method that traces actual cost of each specific item, whether sold or held in inventory; usually used for customized or differentiated products
- weighted-average method
- inventory cost allocation method that calculates the average value inventory items by weighting each purchase lot’s goods available for sale, before dividing by the total number of units of that item
