
Discuss the Role of Accounting for Receivables in Earnings Management
Mitchell Franklin; Patty Graybeal; and Dixon Cooper
Assume that you are an accountant at a large public corporation and are on a team responsible for preparing financial statements. In one team discussion, a dilemma arises: What is the best way to report earnings to create the most favorable possible financial position for your company, while still complying in an ethical manner and also complying fully with generally accepted accounting procedures (GAAP)? Your company is required to follow GAAP rules, but is there a way to comply with these rules while showing the company in its best light? How does receivables accounting factor into this quandary?
Before examining potential ways to improve the company’s financial image, let’s consider some important conditions. To begin, if the company is publicly traded on a national or regional stock exchange, it is subject to the accounting and financial regulations set by the Securities and Exchange Commission (SEC). Included in these rules is the requirement that each publicly traded company must prepare and make public each year its annual report, including the results of an extensive audit procedure performed by a major public accounting firm.
In the process of auditing the company, the auditing firm will conduct tests to determine whether, in the auditor’s opinion, the financial statements accurately reflect the financial position of the company. If the auditor feels that transactions, financial schedules, or other records do not accurately reflect the company’s performance for the past year, then the auditor can issue a negative audit report, which could have major negative effects on the company’s image in the financial community.
To sum up this issue, any attempts by companies to make their financial position look better must be based on assumptions by the company that can be verified by an outside, independent party, such as a major public accounting firm. As you learn about this topic, assume that any recommendations suggested must be legitimate changes in assumptions by the company and that the recommendations will pass public examination and scrutiny.
Earnings management works within GAAP constraints to improve stakeholders’ views of the company’s financial position. Earnings manipulation is noticeably different in that it typically ignores GAAP rules to alter earnings significantly. Carried to an extreme, manipulation can lead to fraudulent behavior by a company. The major problem in income manipulation is not in manipulating the numbers that constitute the financial reports. Instead, the bigger issue is the engineering of the short-term financial operating decisions. Some of the techniques used include applying universal standards, loose interpretations of revenue recognition, unofficial earnings measures, fair value accounting, and cooking the decision and not the books.1
A company may be enticed to manipulate earnings for several reasons. It may want to show a healthier income level, meet or exceed market expectations, and receive management bonuses. This can produce more investment interest from potential investors. An increase to receivables and inventory can help a business to secure more borrowed funds.
The complete financial collapse of the Enron Corporation was a catalyst for major changes in the accounting profession. Fraudulent revenue recognition and financial statement manipulation at Enron—an energy, commodities, and services company—helped provide support for the implementation of the Sarbanes-Oxley Act of 2002 (SOX). A federal law, SOX included the creation of the Public Company Accounting Oversight Board (PCAOB), a regulatory agency to oversee auditors and ensure compliance with SOX requirements.
The PCAOB is charged by the Sarbanes-Oxley Act of 2002 with establishing auditing and professional practice standards for registered public accounting firms to follow in the preparation and issuing of audit reports.2 The PCAOB regulates how publicly traded companies are audited and provides requirements and ethical standards that direct professional accountants in their work with publicly traded companies. Visit their website at www.pcaobus.org to learn more.
Accounts receivable may also be manipulated to delay revenue recognition. These deferred earnings allow for a reduced tax obligation in the current year. A company involved in the sale or acquisition of a business may show a higher income level to increase the value of the business. Whatever the reason, a company often has the flexibility to manage their earnings slightly, given the amount of estimations and potential bad debt write-offs required to meet the revenue recognition and matching principles.
One area of estimation involves bad debt in relation to accounts receivable. As you’ve learned, the income statement method, balance sheet method, and the balance sheet aging method all require estimations of bad debt with receivables. The percentage uncollectible is supposed to be presented as an educated estimation based on past performance, industry standards, and other economic factors. However, this estimation is just that—an estimation—and it can be slightly manipulated or managed to overstate or understate bad debt, as well as accounts receivable. For example, a company does not usually benefit from bad debt write-off. It might legitimately—if past experience justifies the change—alter past-due dates to current accounts to avoid having to write off bad debt. This overstates accounts receivable and understates bad debt. The company could also change the percentage uncollectible to a lower or higher figure, if its financial information and the present economic environment justify the change. The company could change the percentage from 2% uncollectible to 1% uncollectible. This increases accounts receivable and potential earnings and reduces bad debt expenses in the current period.
The Beneish M-Score is an earnings manipulation measurement system that incorporates eight financial ratios to identify potentially compromised companies. In 2000, a group of students from Cornell University used this measurement to sell all the “Cayuga Fund” stock holdings in Enron, one year before the total collapse of company. Read this article on the Cornell University Enron Case Study to learn more.
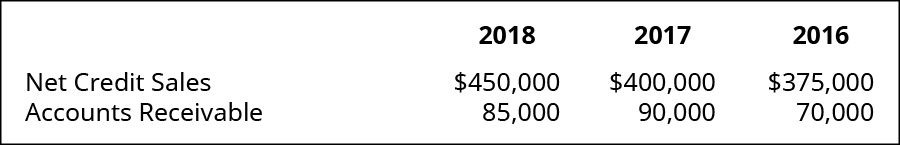
Let’s take Billie’s Watercraft Warehouse (BWW), for example. BWW had the following net credit sales and accounts receivable from 2016–2018.
It also used the following percentage calculations for doubtful accounts under each bad debt estimation method.
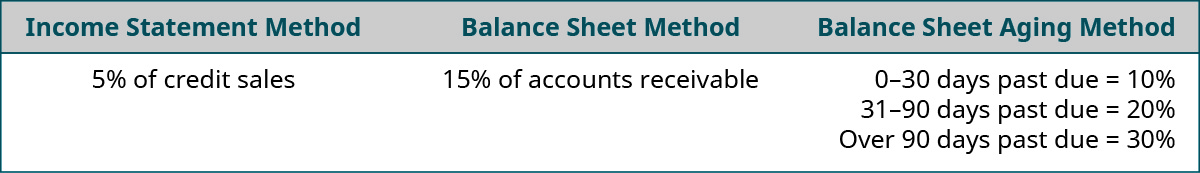
Legitimate current economic conditions could allow BWW to alter its estimation percentages, aging categories, and method used. Altering estimation percentages could mean an increase or decrease in percentages. If BWW decreases its income statement method percentage from 5% of credit sales to 4% of credit sales, the bad debt estimation would go from $22,500 (5% × $450,000) in 2018 to $18,000 (4% × $450,000). The bad debt expense would decrease for the period, and net income would increase. If BWW decreases its balance sheet method percentage from 15% of accounts receivable to 12% of accounts receivable, the bad debt estimation would go from $12,750 (15% × $85,000) in 2018 to $10,200 (12% × $85,000). The bad debt expense would decrease for the period and net income would increase. Accounts receivable would also increase, and allowances for doubtful accounts would decrease. As mentioned, this increase to earnings and asset increase is attractive to investors and lenders.
Another earnings management opportunity may occur with the balance sheet aging method. Past-due categories could expand to encompass greater (or fewer) time periods, accounts receivable balances could be placed in different categories, or estimation percentages could change for each category. However, please remember that such changes would need to be considered acceptable by the company’s outside auditors during the annual independent audit.
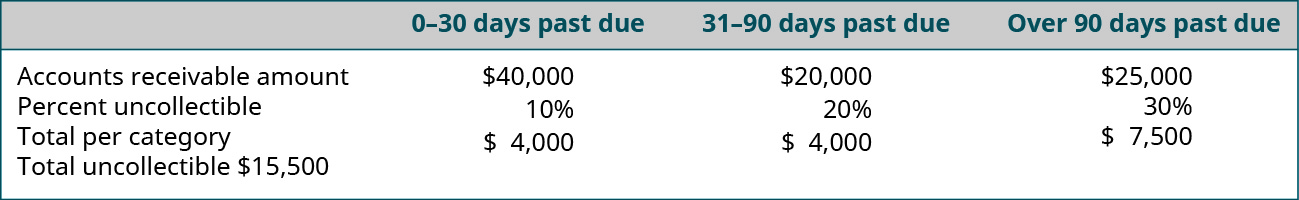
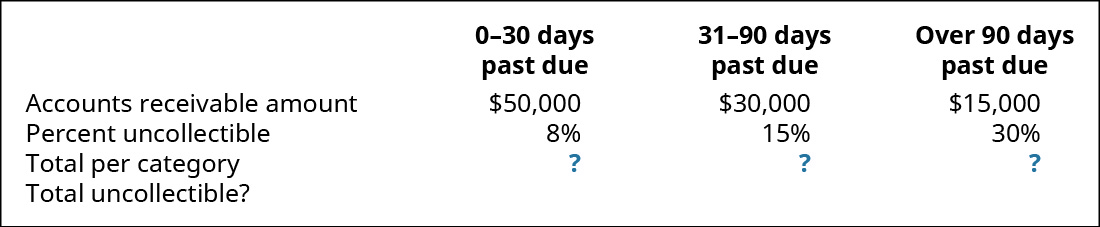
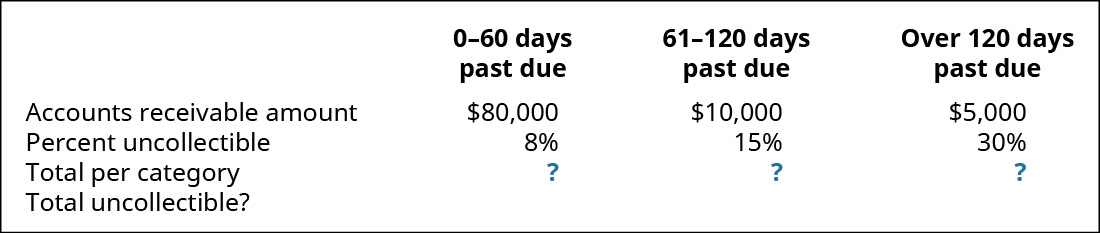
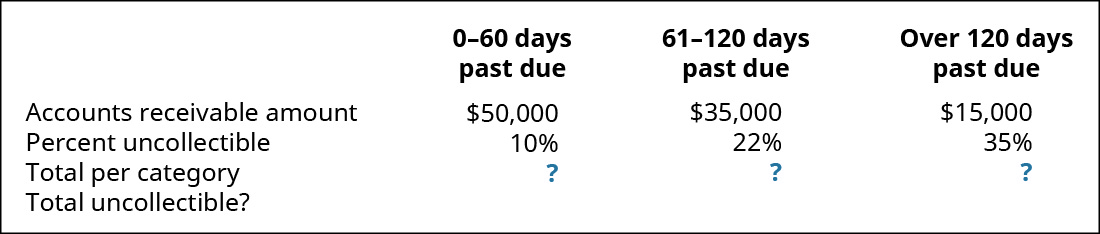
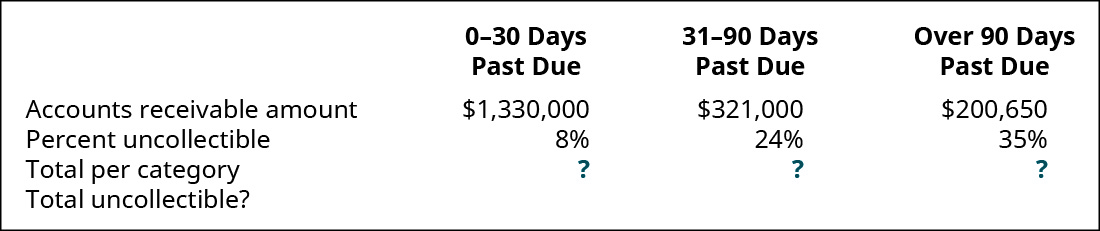
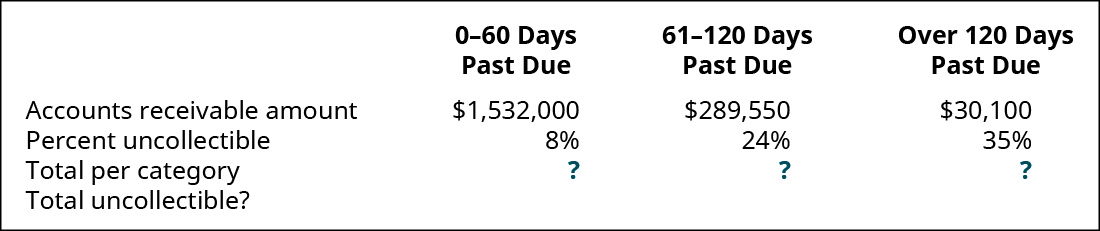
To demonstrate the recommendation, assume that BWW has three categories: 0–30 days past due, 31–90 days past due, and over 90 days past due. These categories could change to 0–60 days, 61–120 days, and over 120 days. This could move accounts that previously had a higher bad debt percentage assigned to them into a lower percentage category. This category shift could produce an increase to accounts receivable, and a decrease to bad debt expense; thus, increasing net income estimation percentages can change within each category. The following is the original uncollectible distribution for BWW in 2018.
The following is the uncollectible percentage distribution change.
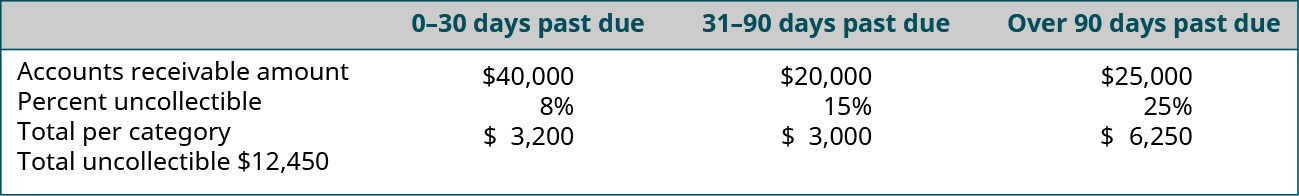
Comparing the two outcomes, the original uncollectible figure was $15,500 and the changed uncollectible figure is $12,450. This reduction produces a higher accounts receivable balance, a lower bad debt expense, and a higher net income.
A company may also change the estimation method to produce a different net income outcome. For example, BWW may go from the income statement method to the balance sheet method. However, as mentioned, the change would have to be considered to reflect the company’s actual bad debt experiences accurately, and not just made for the sake of manipulating the income and expenses reported on their financial statements. A change in the estimation method that provides a comparison of the 2018 income statement follows.
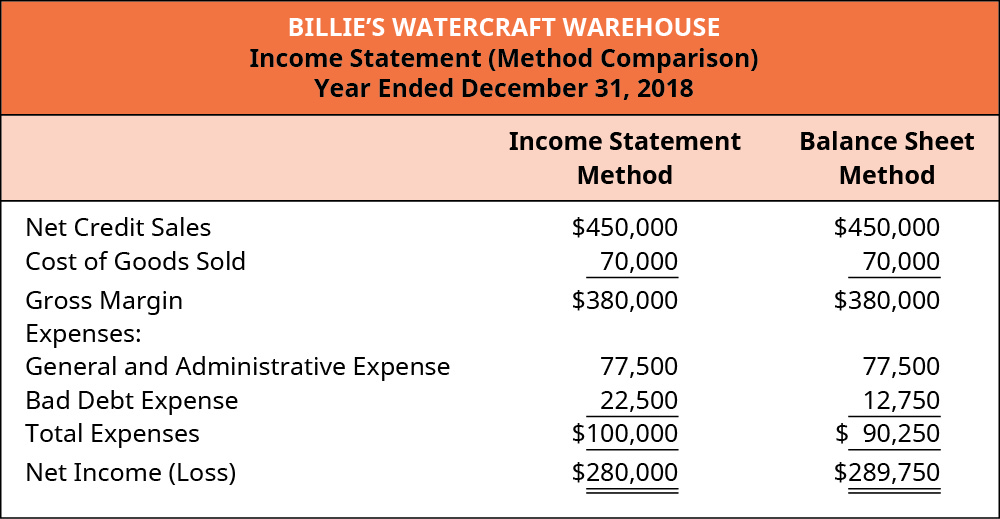
In this example, net income appears higher under the balance sheet method than the income statement method: $280,000 compared to $289,750, respectively. BWW could change to the balance sheet method for estimating bad debt to give the appearance that income is greater. An investor or lender looking at BWW may consider providing funds given the earnings performance, unaware that the estimation method alone may result in an inflated income. So, what can an investor or lender do to recognize earnings management (or manipulation)?
An investor or lender can compare ratio analysis to others in the industry, and year-to-year trend analysis can be helpful. The number of days’ sales in receivables ratio is a usually a good indicator of manipulation activity. A quicker collection period found in the first two years of operation can signal negative earnings behavior (as compared to industry standards). Earnings management can be a bit more difficult, given its acceptability under GAAP. As with uncovering earnings manipulation, due diligence with ratio and trend analysis is paramount. These topics will be covered in more depth in Appendix A: Financial Statement Analysis.
As companies become large players in industry, they may consider acquiring competitors. When acquisition discussions occur, financial information, future growth channels, and business organizational structure play heavy roles in the decision process. A level of financial transparency is expected with an acquisition candidate, but during buying negotiations, each business will present the best financial position possible. The seller’s goal is to yield a high sales price; the desire to present a rosy picture could lead to earnings manipulation. An acquirer needs to be mindful of this and review trend analysis and ratio comparisons before making a purchase decision.
Consider General Electric Company (GE). GE’s growth model in recent years was based on acquiring additional businesses within the industry. The company did not do its due diligence on several acquisitions, including Baker Hughes, and it was misled to believe the acquired businesses were in a stable financial earnings position. The acquisitions led to a declining financial position and reduced stock price. In order for GE to restructure and return to a positive growth model, it had to sell its interests in Baker Hughes and other acquisitions that were underperforming based on expectations.
Summary
- Companies may look to report earnings differently to improve stakeholder’s views of financial position. Earnings management works within GAAP to accomplish this, while earnings manipulation ignores GAAP.
- Companies may choose to manage earnings to improve income level, increase borrowing opportunities, decrease tax liabilities, and improve company valuation for sales transactions. Accounts receivable is often prey to earnings manipulations.
- Earnings management can occur in several ways, including changes to bad debt estimation methods, percentage uncollectible figures, and category distribution within the balance sheet aging method.
- To understand company performance and unveil any management or manipulation to earnings, ratio analysis is paramount. Number of days’ sales in receivables ratio, and trend analysis, are most commonly used.
Multiple Choice
(Figure)Which of the following is not a way to manage earnings?
- Change the method for bad debt estimation.
- Change the figure for the uncollectible percentage.
- Under the balance sheet aging method, change the past-due categories.
- Change the dates of common stock issuance.
D
(Figure)Which of the following is true about earnings management?
- It works within the constraints of GAAP.
- It works outside the constraints of GAAP.
- It tries to improve stakeholder’s views of the company’s financial position.
- Both B and C
- Both A and C
(Figure)Which statement is most directly affected by a change to net income?
- balance sheet
- income statement
- statement of retained earnings
- statement of cash flows
B
(Figure)Michelle Company reports $345,000 in credit sales and $267,500 in accounts receivable at the end of 2019. Michelle currently uses the income statement method to record bad debt estimation at 4%. To manage earnings more efficiently, Michelle changes bed debt estimation to the balance sheet method at 4%. How much is the difference in net income between the income statement and balance sheet methods?
- $3,100
- $13,800
- $10,700
- $77,500
Questions
(Figure)What is the difference between earnings management and earnings manipulation?
(Figure)What is an earnings management benefit from showing a reduced figure for bad debt expense?
A decrease to bad debt expense increases net income, which can show a higher income level and improve opportunities for borrowing.
(Figure)Angelo’s Outlet used to report bad debt using the balance sheet method and is now switching to the income statement method. The percentage uncollectible will remain constant at 5%. Credit sales figures for 2019 were $866,000, and accounts receivable was $732,000. How much will Angelo’s Outlet report for 2019 bad debt estimation under the income statement method?
(Figure)What is an earnings management benefit from showing an increased figure for bad debt expense?
A higher bad debt expense figure reduces net income, which could have a positive impact on reducing business income and other taxes.
Exercise Set A
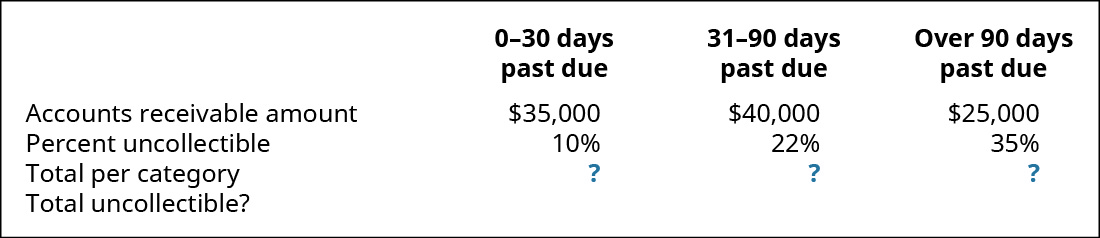
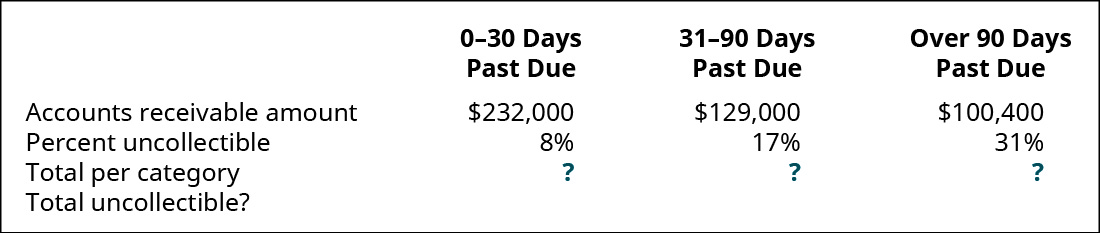
(Figure)Mirror Mart uses the balance sheet aging method to account for uncollectible debt on receivables. The following is the past-due category information for outstanding receivable debt for 2019.
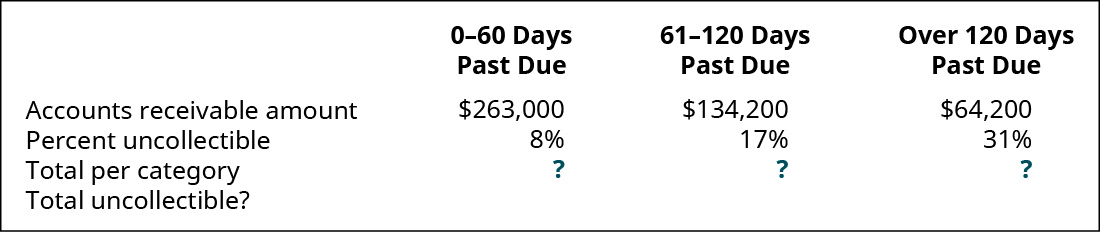
To manage earnings more efficiently, Mirror Mart decided to change past-due categories as follows.
Complete the following.
- Complete each table by filling in the blanks.
- Determine the difference between total uncollectible.
- Explain how the new total uncollectible amount affects net income and accounts receivable.
(Figure)Aerospace Electronics reports $567,000 in credit sales for 2018 and $632,500 in 2019. They have a $499,000 accounts receivable balance at the end of 2018, and $600,000 at the end of 2019. Aerospace uses the income statement method to record bad debt estimation at 5% during 2018. To manage earnings more favorably, Aerospace changes bad debt estimation to the balance sheet method at 7% during 2019.
- Determine the bad debt estimation for 2018.
- Determine the bad debt estimation for 2019.
- Describe a benefit to Aerospace Electronics in 2019 as a result of its earnings management.
(Figure)Dortmund Stockyard reports $896,000 in credit sales for 2018 and $802,670 in 2019. It has a $675,000 accounts receivable balance at the end of 2018, and $682,000 at the end of 2019. Dortmund uses the balance sheet method to record bad debt estimation at 8% during 2018. To manage earnings more favorably, Dortmund changes bad debt estimation to the income statement method at 6% during 2019.
- Determine the bad debt estimation for 2018.
- Determine the bad debt estimation for 2019.
- Describe a benefit to Dortmund Stockyard in 2019 as a result of its earnings management.
Exercise Set B
(Figure)Outpost Designs uses the balance sheet aging method to account for uncollectible debt on receivables. The following is the past-due category information for outstanding receivable debt for 2019.
To manage earnings more favorably, Outpost Designs decided to change past-due categories as follows.
Complete the following.
- Complete each table by filling in the blanks.
- Determine the difference between total uncollectible.
- Explain how the new total uncollectible amount affects net income and accounts receivable.
(Figure)Clovis Enterprises reports $845,500 in credit sales for 2018 and $933,000 in 2019. It has a $758,000 accounts receivable balance at the end of 2018 and $841,000 at the end of 2019. Clovis uses the income statement method to record bad debt estimation at 4% during 2018. To manage earnings more favorably, Clovis changes bad debt estimation to the balance sheet method at 5% during 2019.
- Determine the bad debt estimation for 2018.
- Determine the bad debt estimation for 2019.
- Describe a benefit to Clovis Enterprises in 2019 as a result of its earnings management.
(Figure)Fortune Accounting reports $1,455,000 in credit sales for 2018 and $1,678,430 in 2019. It has an $825,000 accounts receivable balance at the end of 2018 and $756,000 at the end of 2019. Fortune uses the balance sheet method to record bad debt estimation at 7.5% during 2018. To manage earnings more favorably, Fortune changes bad debt estimation to the income statement method at 5.5% during 2019.
- Determine the bad debt estimation for 2018.
- Determine the bad debt estimation for 2019.
- Describe a benefit to Fortune in 2019 as a result of its earnings management.
Problem Set A
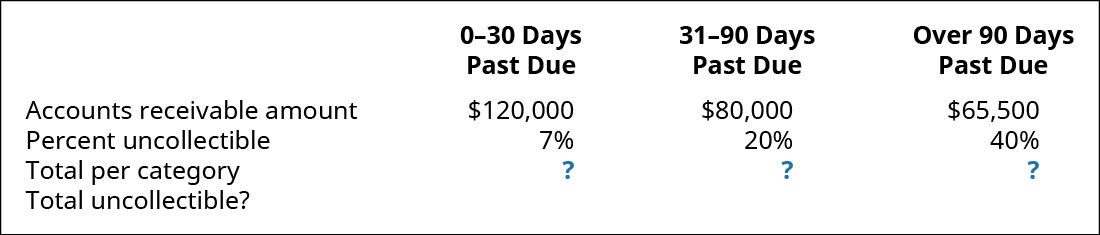
(Figure)Noren Company uses the balance sheet aging method to account for uncollectible debt on receivables. The following is the past-due category information for outstanding receivable debt for 2019.
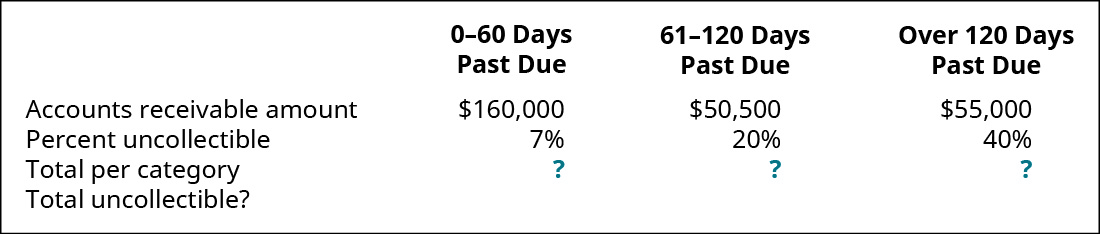
To manage earnings more favorably, Noren Company considers changing the past-due categories as follows.
- Complete each table by filling in the blanks.
- Determine the difference between totals uncollectible.
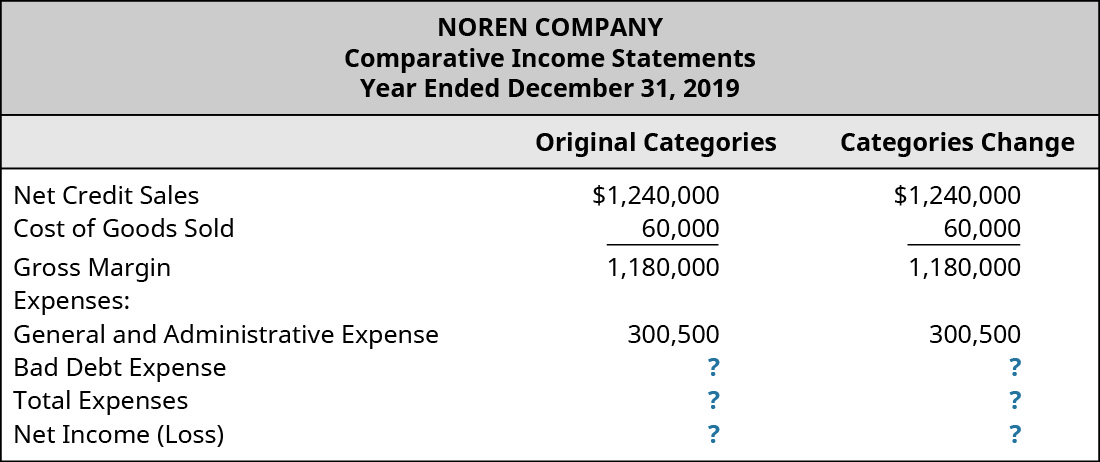
- Complete the following 2019 comparative income statements for 2019, showing net income changes as a result of the changes to the balance sheet aging method categories.
- Describe the categories change effect on net income and accounts receivable.
(Figure)Elegant Universal uses the balance sheet aging method to account for uncollectible debt on receivables. The following is the past-due category information for outstanding receivable debt for 2019.
To manage earnings more favorably, Elegant Universal considers changing the past-due categories as follows.
- Complete each table by filling in the blanks.
- Determine the difference between totals uncollectible.
- Describe the categories change effect on net income and accounts receivable.
Problem Set B
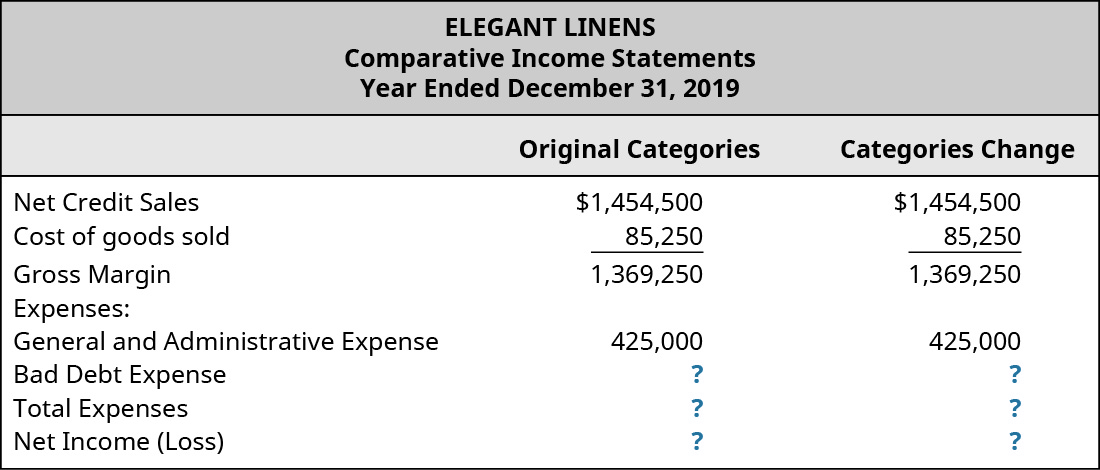
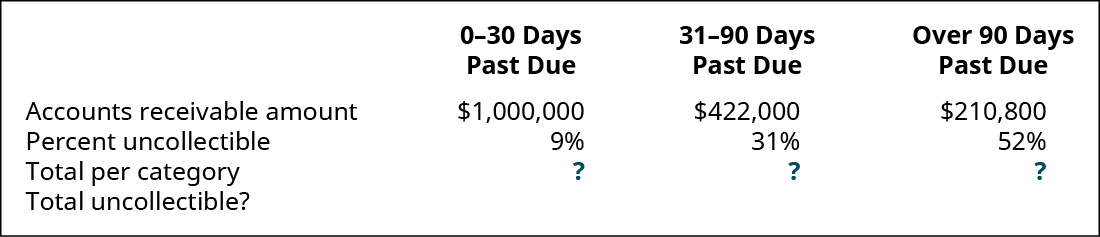
(Figure)Elegant Linens uses the balance sheet aging method to account for uncollectible debt on receivables. The following is the past-due category information for outstanding receivable debt for 2019.
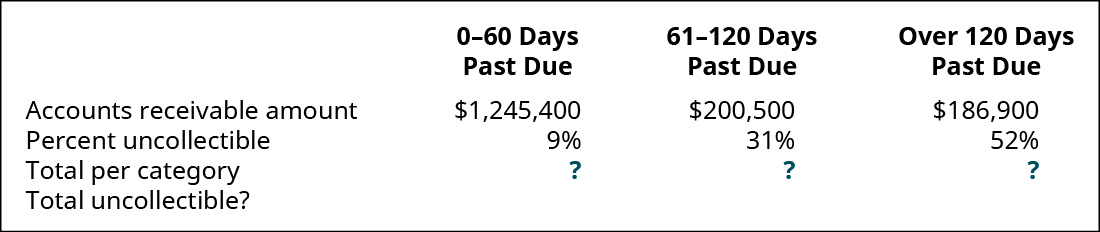
To manage earnings more favorably, Elegant Linens considers changing the past-due categories as follows.
- Complete each table by filling in the blanks.
- Determine the difference between total uncollectible.
- Complete the following 2019 comparative income statements for 2019, showing net income changes as a result of the changes to the balance sheet aging method categories.
- Describe the categories change effect on net income and accounts receivable.
(Figure)Goods for Less uses the balance sheet aging method to account for uncollectible debt on receivables. The following is the past-due category information for outstanding receivable debt for 2019.
To manage earnings more favorably, Goods for Less considers changing the past-due categories as follows.
- Complete each table by filling in the blanks.
- Determine the difference between totals uncollectible.
- Describe the categories change effect on net income and accounts receivable.
Thought Provokers
(Figure)You are considering two possible companies for investment purposes. The following data is available for each company.
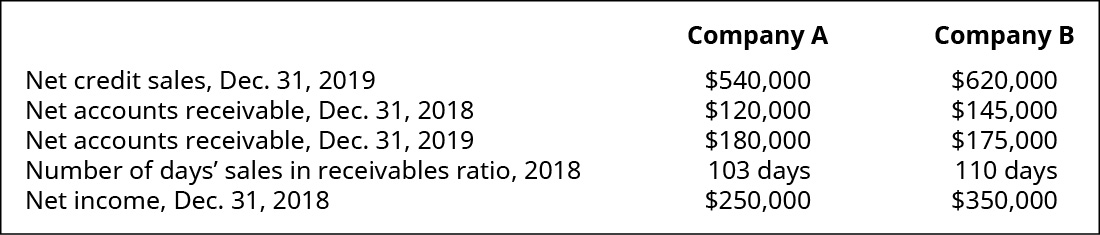
Additional Information: Company A: Bad debt estimation percentage using the income statement method is 6%, and the balance sheet method is 10%. The $230,000 in Other Expenses includes all company expenses except Bad Debt Expense. Company B: Bad debt estimation percentage using the income statement method is 6.5%, and the balance sheet method is 8%. The $140,000 in Other Expenses includes all company expenses except Bad Debt Expense.
- Compute the number of days’ sales in receivables ratio for each company for 2019 and interpret the results (round answers to nearest whole number).
- If Company A changed from the income statement method to the balance sheet method for recognizing bad debt estimation, how would that change net income in 2019? Explain (show calculations).
- If Company B changed from the balance sheet method to the income statement method for recognizing bad debt estimation, how would that change net income in 2019? Explain (show calculations).
- What benefits do each company gain by changing their method of bad debt estimation?
- Which company would you invest in and why? Provide supporting details.
Footnotes
Glossary
- earnings management
- works within GAAP constraints to improve stakeholders’ views of the company’s financial position
- earnings manipulation
- ignores GAAP rules to alter earnings significantly to improve stakeholder’s views of the company’s financial position
