
Calculate the Cost of Goods Sold and Ending Inventory Using the Periodic Method
Mitchell Franklin; Patty Graybeal; and Dixon Cooper
As you’ve learned, the periodic inventory system is updated at the end of the period to adjust inventory numbers to match the physical count and provide accurate merchandise inventory values for the balance sheet. The adjustment ensures that only the inventory costs that remain on hand are recorded, and the remainder of the goods available for sale are expensed on the income statement as cost of goods sold. Here we will demonstrate the mechanics used to calculate the ending inventory values using the four cost allocation methods and the periodic inventory system.
Information Relating to All Cost Allocation Methods, but Specific to Periodic Inventory Updating
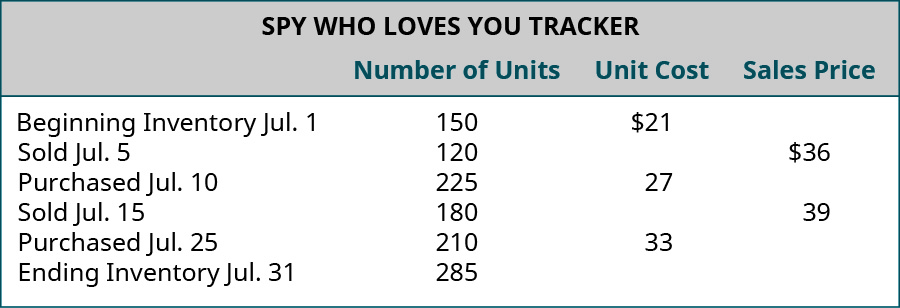
Let’s return to the example of The Spy Who Loves You Corporation to demonstrate the four cost allocation methods, assuming inventory is updated at the end of the period using the periodic system.
Cost Data for Calculations
Company: Spy Who Loves You Corporation
Product: Global Positioning System (GPS) Tracking Device
Description: This product is an economical real-time GPS tracking device, designed for individuals who wish to monitor others’ whereabouts. It is being marketed to parents of middle school and high school students as a safety measure. Parents benefit by being apprised of the child’s location, and the student benefits by not having to constantly check in with parents. Demand for the product has spiked during the current fiscal period, while supply is limited, causing the selling price to escalate rapidly. Note: For simplicity of demonstration, beginning inventory cost is assumed to be $21 per unit for all cost assumption methods.
Specific Identification
The specific units assumed to be sold in this period are designated as follows, with the specific inventory distinction being associated with the lot numbers:
- Sold 120 units, all from Lot 1 (beginning inventory), costing $21 per unit
- Sold 180 units, 20 from Lot 1 (beginning inventory), costing $21 per unit; 160 from the Lot 2 (July 10 purchase), costing $27 per unit
The specific identification method of cost allocation directly tracks each of the units purchased and costs them out as they are actually sold. In this demonstration, assume that some sales were made by specifically tracked goods that are part of a lot, as previously stated for this method. So for The Spy Who Loves You, considering the entire period together, note that
- 140 of the 150 units that were purchased for $21 were sold, leaving 10 of $21 units remaining
- 160 of the 225 units that were purchased for $27 were sold, leaving 65 of the $27 units remaining
- none of the 210 units that were purchased for $33 were sold, leaving all 210 of the $33 units remaining
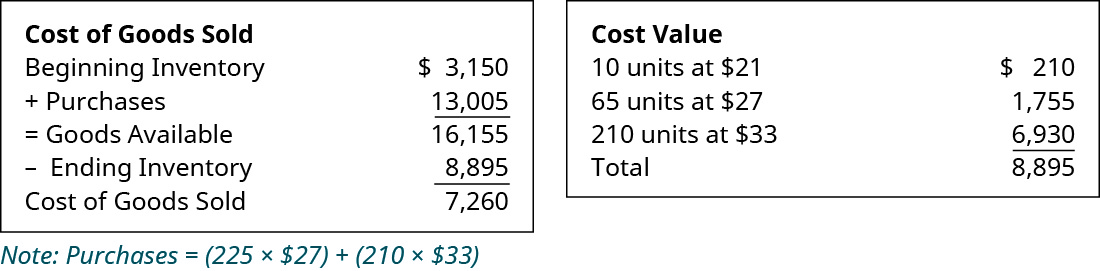
Ending inventory was made up of 10 units at $21 each, 65 units at $27 each, and 210 units at $33 each, for a total specific identification ending inventory value of $8,895. Subtracting this ending inventory from the $16,155 total of goods available for sale leaves $7,260 in cost of goods sold this period.
Calculations of Costs of Goods Sold, Ending Inventory, and Gross Margin, Specific Identification
The specific identification costing assumption tracks inventory items individually, so that when they are sold, the exact cost of the item is used to offset the revenue from the sale. The cost of goods sold, inventory, and gross margin shown in (Figure) were determined from the previously-stated data, particular to specific identification costing.
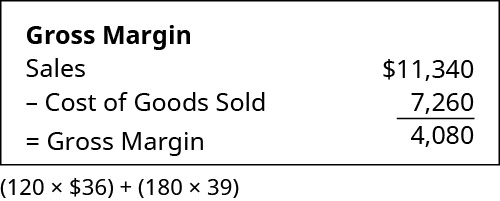
The gross margin, resulting from the specific identification periodic cost allocations of $7,260, is shown in (Figure).
Calculation for the Ending Inventory Adjustment under Periodic/Specific Identification Methods
Merchandise inventory, before adjustment, had a balance of $3,150, which was the beginning inventory. Journal entries are not shown, but the following calculations provide the information that would be used in recording the necessary journal entries. The inventory at the end of the period should be $8,895, requiring an entry to increase merchandise inventory by $5,745. Cost of goods sold was calculated to be $7,260, which should be recorded as an expense. The credit entry to balance the adjustment is $13,005, which is the total amount that was recorded as purchases for the period. This entry distributes the balance in the purchases account between the inventory that was sold (cost of goods sold) and the amount of inventory that remains at period end (merchandise inventory).
First-in, First-out (FIFO)
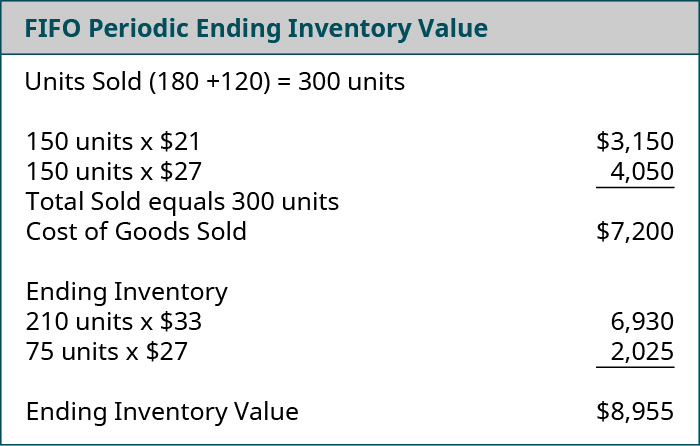
The first-in, first-out method (FIFO) of cost allocation assumes that the earliest units purchased are also the first units sold. For The Spy Who Loves You, considering the entire period, 300 of the 585 units available for the period were sold, and if the earliest acquisitions are considered sold first, then the units that remain under FIFO are those that were purchased last. Following that logic, ending inventory included 210 units purchased at $33 and 75 units purchased at $27 each, for a total FIFO periodic ending inventory value of $8,955. Subtracting this ending inventory from the $16,155 total of goods available for sale leaves $7,200 in cost of goods sold this period.
Calculations of Costs of Goods Sold, Ending Inventory, and Gross Margin, First-in, First-out (FIFO)
The FIFO costing assumption tracks inventory items based on segments or lots of goods that are tracked, in the order that they were acquired, so that when they are sold, the earliest acquired items are used to offset the revenue from the sale. The cost of goods sold, inventory, and gross margin shown in (Figure) were determined from the previously-stated data, particular to FIFO costing.
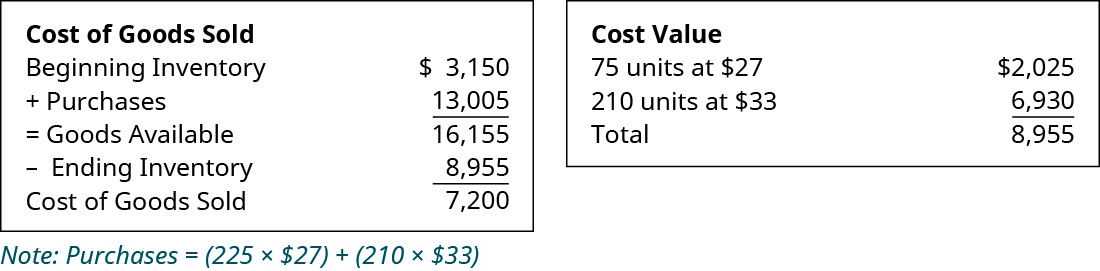
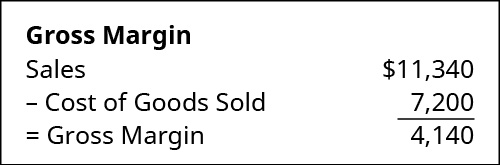
The gross margin, resulting from the FIFO periodic cost allocations of $7,200, is shown in (Figure).
Calculations for Inventory Adjustment, Periodic/First-in, First-out (FIFO)
Beginning merchandise inventory had a balance of $3,150 before adjustment. The inventory at period end should be $8,955, requiring an entry to increase merchandise inventory by $5,895. Journal entries are not shown, but the following calculations provide the information that would be used in recording the necessary journal entries. Cost of goods sold was calculated to be $7,200, which should be recorded as an expense. The credit entry to balance the adjustment is for $13,005, which is the total amount that was recorded as purchases for the period. This entry distributes the balance in the purchases account between the inventory that was sold (cost of goods sold) and the amount of inventory that remains at period end (merchandise inventory).
Last-in, First-out (LIFO)
The last-in, first-out method (LIFO) of cost allocation assumes that the last units purchased are the first units sold. For The Spy Who Loves You, considering the entire period together, 300 of the 585 units available for the period were sold, and if the latest acquisitions are considered sold first, then the units that remain under LIFO are those that were purchased first. Following that logic, ending inventory included 150 units purchased at $21 and 135 units purchased at $27 each, for a total LIFO periodic ending inventory value of $6,795. Subtracting this ending inventory from the $16,155 total of goods available for sale leaves $9,360 in cost of goods sold this period.
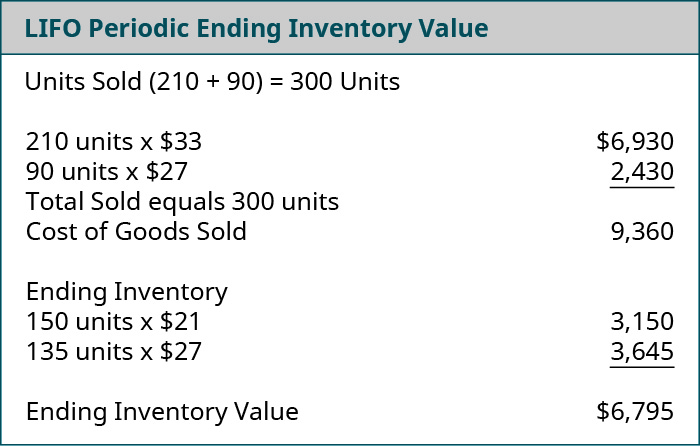
It is important to note that these answers can differ when calculated using the perpetual method. When perpetual methodology is utilized, the cost of goods sold and ending inventory are calculated at the time of each sale rather than at the end of the month. For example, in this case, when the first sale of 150 units is made, inventory will be removed and cost computed as of that date from the beginning inventory. The differences in timing as to when cost of goods sold is calculated can alter the order that costs are sequenced.
Calculations of Costs of Goods Sold, Ending Inventory, and Gross Margin, Last-in, First-out (LIFO)
The LIFO costing assumption tracks inventory items based on lots of goods that are tracked, in the order that they were acquired, so that when they are sold, the latest acquired items are used to offset the revenue from the sale. The following cost of goods sold, inventory, and gross margin were determined from the previously-stated data, particular to LIFO costing.
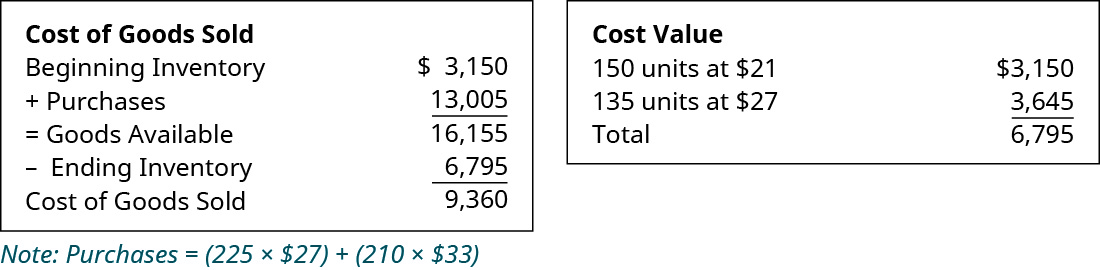
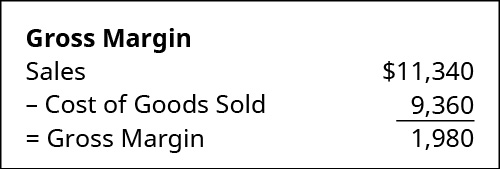
The gross margin, resulting from the LIFO periodic cost allocations of $9,360, is shown in (Figure).
Calculations for Inventory Adjustment, Periodic/Last-in, First-out (LIFO)
Beginning merchandise inventory had a balance before adjustment of $3,150. The inventory at period end should be $6,795, requiring an entry to increase merchandise inventory by $3,645. Journal entries are not shown, but the following calculations provide the information that would be used in recording the necessary journal entries. Cost of goods sold was calculated to be $9,360, which should be recorded as an expense. The credit entry to balance the adjustment is for $13,005, which is the total amount that was recorded as purchases for the period. This entry distributes the balance in the purchases account between the inventory that was sold (cost of goods sold) and the amount of inventory that remains at period end (merchandise inventory).
Weighted-Average Cost (AVG)
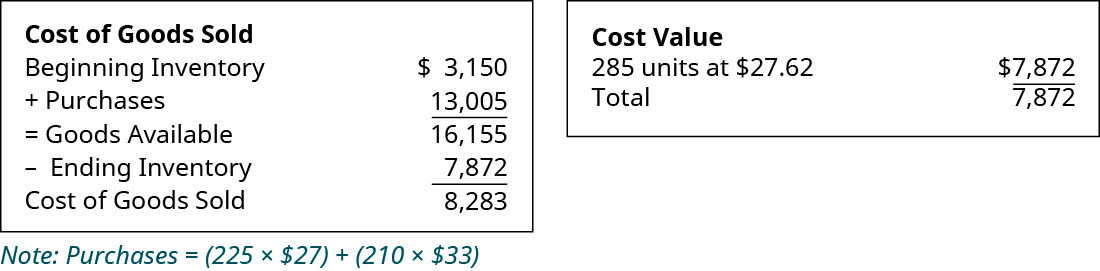
Weighted-average cost allocation requires computation of the average cost of all units in goods available for sale at the time the sale is made. For The Spy Who Loves You, considering the entire period, the weighted-average cost is computed by dividing total cost of goods available for sale ($16,155) by the total number of available units (585) to get the average cost of $27.62. Note that 285 of the 585 units available for sale during the period remained in inventory at period end. Following that logic, ending inventory included 285 units at an average cost of $27.62 for a total AVG periodic ending inventory value of $7,872. Subtracting this ending inventory from the $16,155 total of goods available for sale leaves $8,283 in cost of goods sold this period. It is important to note that final numbers can often differ by one or two cents due to rounding of the calculations. In this case, the cost comes to $27.6154 but rounds up to the stated cost of $27.62.
Calculations of Costs of Goods Sold, Ending Inventory, and Gross Margin, Weighted Average (AVG)
The AVG costing assumption tracks inventory items based on lots of goods that are tracked but averages the cost of all units on hand every time an addition is made to inventory so that, when they are sold, the most recently averaged cost items are used to offset the revenue from the sale. The cost of goods sold, inventory, and gross margin shown in (Figure) were determined from the previously-stated data, particular to AVG costing.
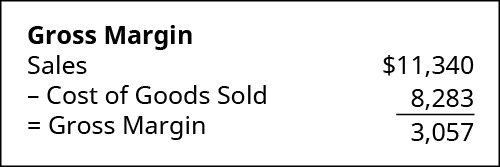
(Figure) shows the gross margin resulting from the weighted-average periodic cost allocations of $8283.
Journal Entries for Inventory Adjustment, Periodic/Weighted Average
Beginning merchandise inventory had a balance before adjustment of $3,150. The inventory at period end should be $7,872, requiring an entry to increase merchandise inventory by $4,722. Journal entries are not shown, but the following calculations provide the information that would be used in recording the necessary journal entries. Cost of goods sold was calculated to be $8,283, which should be recorded as an expense. The credit entry to balance the adjustment is for $13,005, which is the total amount that was recorded as purchases for the period. This entry distributes the balance in the purchases account between the inventory that was sold (cost of goods sold) and the amount of inventory that remains at period end (merchandise inventory).
Key Concepts and Summary
- The periodic inventory system updates inventory at the end of a fixed accounting period. During the accounting period, inventory records are not changed, and at the end of the period, inventory records are adjusted for what was sold and added during the period.
- Companies using the periodic and perpetual method for inventory updating choose between the basic four cost flow assumption methods, which are first-in, first-out (FIFO); last-in, first-out (LIFO); specific identification (SI); and weighted average (AVG).
- Periodic inventory systems are still used in practice, but the prevalence of their use has greatly diminished, with advances in technology and as prices for inventory management software have significantly decreased.
(Figure)Which of these statements is false?
- If cost of goods sold is incorrect, ending inventory is usually incorrect too.
- beginning inventory + purchases = cost of goods sold
- ending inventory + cost of goods sold = goods available for sale
- goods available for sale – beginning inventory = purchases
B
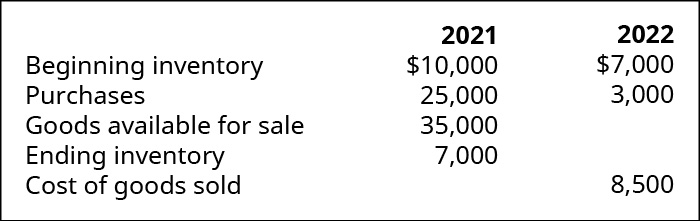
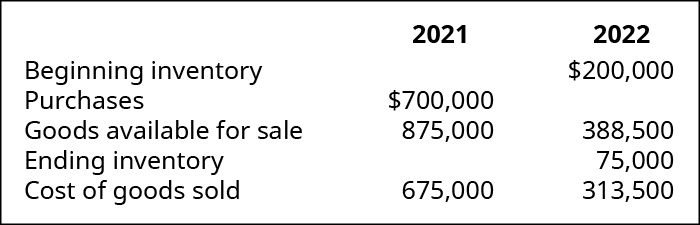
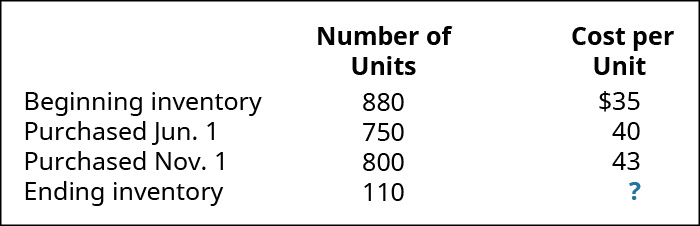
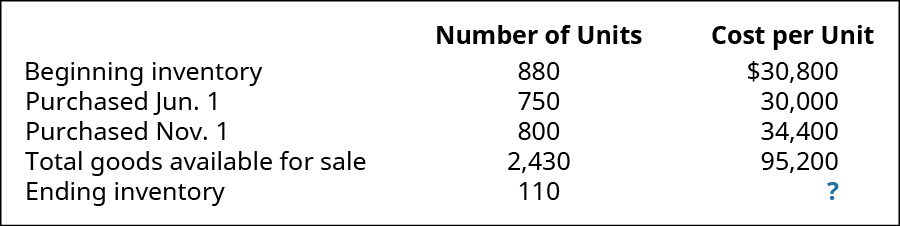
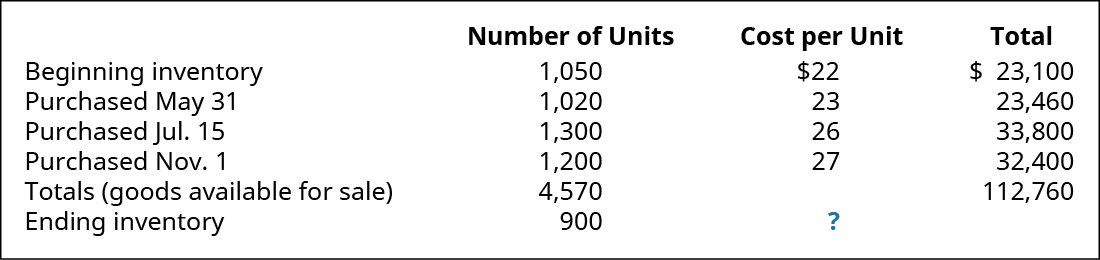
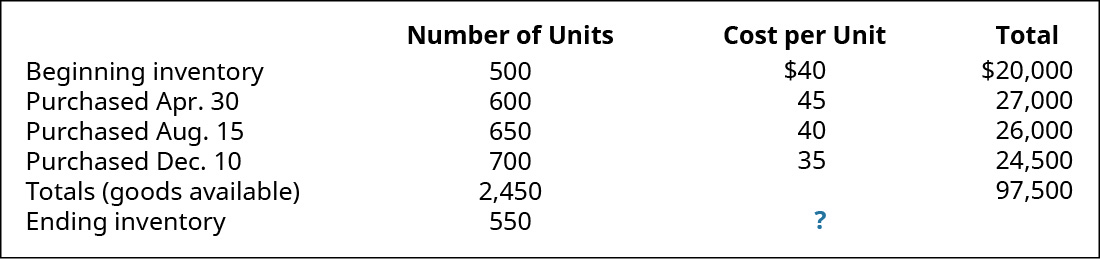
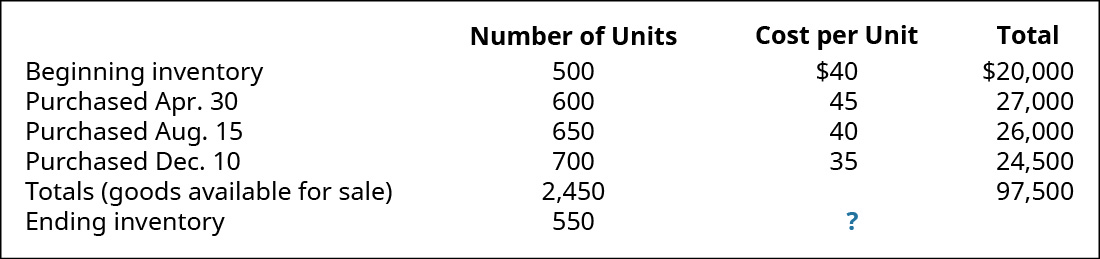
(Figure)Complete the missing piece of information involving the changes in inventory, and their relationship to goods available for sale, for the two years shown:
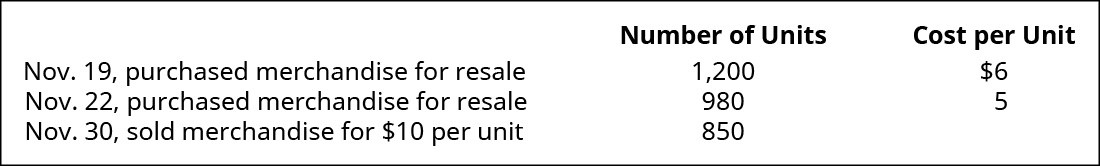
(Figure)Akira Company had the following transactions for the month.
Calculate the ending inventory dollar value for the period for each of the following cost allocation methods, using periodic inventory updating. Provide your calculations.
- first-in, first-out (FIFO)
- last-in, first-out (LIFO)
- weighted average (AVG)
(Figure)Akira Company had the following transactions for the month.
Calculate the gross margin for the period for each of the following cost allocation methods, using periodic inventory updating. Assume that all units were sold for $25 each. Provide your calculations.
- first-in, first-out (FIFO)
- last-in, first-out (LIFO)
- weighted average (AVG)
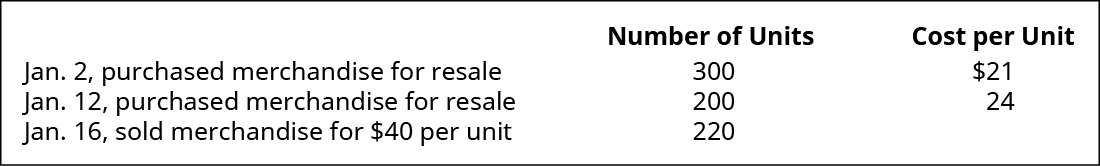
(Figure)Prepare journal entries to record the following transactions, assuming periodic inventory updating and first-in, first-out (FIFO) cost allocation.
(Figure)Complete the missing piece of information involving the changes in inventory, and their relationship to goods available for sale, for the two years shown.
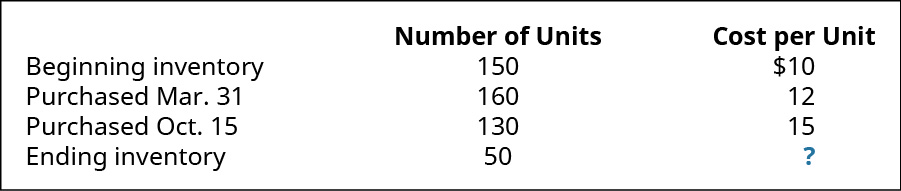
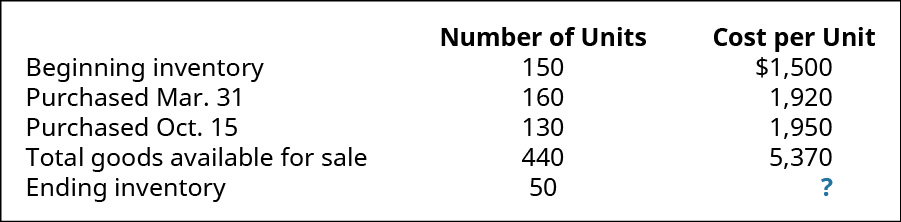
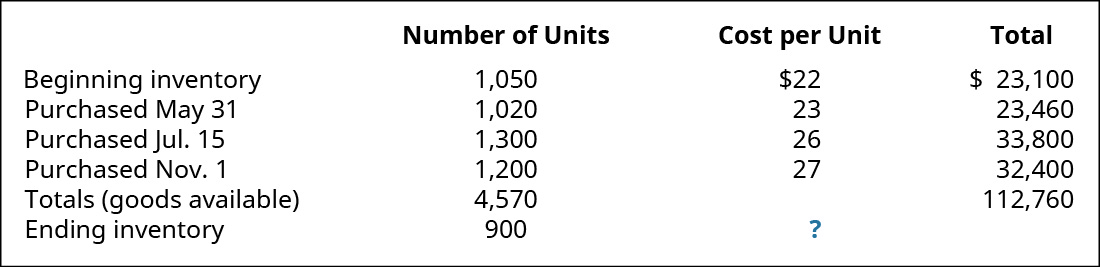
(Figure)Bleistine Company had the following transactions for the month.
Calculate the ending inventory dollar value for each of the following cost allocation methods, using periodic inventory updating. Provide your calculations.
- first-in, first-out (FIFO)
- last-in, first-out (LIFO)
- weighted average (AVG)
(Figure)Bleistine Company had the following transactions for the month.
Calculate the gross margin for the period for each of the following cost allocation methods, using periodic inventory updating. Assume that all units were sold for $50 each. Provide your calculations.
- first-in, first-out (FIFO)
- last-in, first-out (LIFO)
- weighted average (AVG)
(Figure)Prepare journal entries to record the following transactions, assuming periodic inventory updating and first-in, first-out (FIFO) cost allocation.
(Figure)Trini Company had the following transactions for the month.
Calculate the ending inventory dollar value for each of the following cost allocation methods, using periodic inventory updating. Provide your calculations.
- first-in, first-out (FIFO)
- last-in, first-out (LIFO)
- weighted average (AVG)
(Figure)Trini Company had the following transactions for the month.
Calculate the cost of goods sold dollar value for the period for each of the following cost allocation methods, using periodic inventory updating. Provide your calculations.
- first-in, first-out (FIFO)
- last-in, first-out (LIFO)
- weighted average (AVG)
(Figure)DeForest Company had the following transactions for the month.
Calculate the ending inventory dollar value for the period for each of the following cost allocation methods, using periodic inventory updating. Provide your calculations.
- first-in, first-out (FIFO)
- last-in, first-out (LIFO)
- weighted average (AVG)
(Figure)Assume your company uses the periodic inventory costing method, and the inventory count left out an entire warehouse of goods that were in stock at the end of the year, with a cost value of $222,000. How will this affect your net income in the current year? How will it affect next year’s net income?
