
LO 14.5 Use Information from the Statement of Cash Flows to Prepare Ratios to Assess Liquidity and Solvency
Mitchell Franklin
Cash flow ratio analysis allows financial statement users to see the company’s liquidity position from a clearer perspective. The ratios presented in this section focus on free cash flow, calculated as operating cash, reduced by expected capital expenditures and by cash dividends payments. The free cash flow value is thus an adaptation of cash flow from operating activities. The result obtained in the initial free cash flow calculation is then used to calculate the free cash flow to sales ratio, which is the ratio of free cash flow to sales revenue, and the free cash flow to assets ratio, which is the ratio of free cash flow to total assets. These three tools give indicators about the company’s flexibility and agility, which equates to their ability to seize opportunities in the future, as they arise.
Cash is required to pay the bills. All businesses need to have a clear picture of available cash so they can plan and pay their bills. The statement of cash flows allows investors direct insight into the actual activity on the company’s cash balances. Mark A. Siegel wrote in The CPA Journal that “as Wall Street analysts have lost faith in earnings-based metrics in the wake of Enron, WorldCom, and others, many have gravitated toward the cash flow statement. Companies are regularly evaluated on the basis of free cash flow yield and other measures of cash generation.”1 The operating cash flow ratio, and the cash flow margin ratio, and the other cash flow–related metrics discussed allow an investor and other users of the financial statements to analyze financial statement data to see a company’s ability to pay for current debt and assess its operational cash flow to function as a going concern.2 This helps investors and other users of the financial statements ensure the veracity of a company’s financial statements and its ability to pay its bills.
Free Cash Flow
Free cash flow calculations start with cash flows from operating activities, reduced by planned capital expenditures and planned cash dividend payments. In the example case demonstrated, free cash flow would be as follows:
Free cash flow calculation:
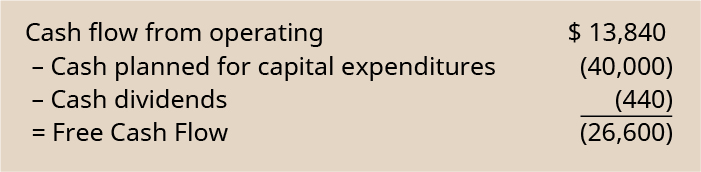
The absence of free cash flow is an indicator of severe liquidity concern for Propensity Company and could be an early indicator that the company may not be able to continue operations. This could also be a one-time occurrence, in a year where a large capital investment was planned, to be financed with resources from the company’s capital reserves from previous years’ profits. In such a case, the negative free cash flow would not be an issue of concern.
This article by Investopedia presents information about how to use free cash flow to evaluate strengths of various businesses:
Cash Flows to Sales
The cash flows to sales ratio is computed by dividing free cash flow by sales revenue. In the Propensity Company case, free cash flow had a negative outcome, so the calculation would not be useful in this case.
Cash Flows to Assets
The cash flows to assets ratio is computed by dividing free cash flow by total assets. Again, when the free cash flow had a negative outcome, as it did in the Propensity Company example scenario, the calculation would not be useful
Between 2005 and 2007, Lehman Brothers (an investment bank) increased its net income from $3.1 billion to $4.1 billion. It received nearly $42 billion interest and dividends on its investments, a primary part of its business model, in 2007 alone. It also had $7.2 billion available in cash at the end of 2007. Would you be interested in investing in Lehman Brothers? However, Lehman Brothers went bankrupt in September 2008; it was the biggest corporate bankruptcy in history. Could investors have known?
A clue would be its free cash ratio. Assuming that you would expect Lehman Brothers’ actual capital expenditures and dividend payments from 2007 be expected in 2008, Lehman’s free cash ratio would be calculated as, in millions:
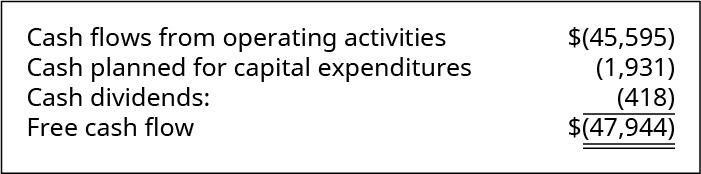
Lehman Brothers invested heavily in securities created from subprime mortgages. When the subprime mortgage market collapsed in 2008, Lehman Brothers was not able to generate enough cash to stay in business. The large negative free cash flow gave warning that Lehman Brothers was a risky investment.
In every type of business across the globe, it is important to understand the business’s cash position. Analyzing cash inflows and outflows, current cash flow, and cash flow trends, and predicting future cash flows all importantly inform decision-making. The US Securities and Exchange Commission (SEC) requires the statement of cash flows as the mechanism that allows users to better assess a company’s cash position. US generally accepted accounting principles (GAAP) and International Financial Reporting Standards (IFRS) set forth rules regarding the composition and presentation of the statement of cash flows.
- Method: Both GAAP and IFRS recommend and encourage the direct method of preparing the statement of cash flows but allow the indirect method. Under US GAAP, if the direct method is used, a reconciliation between net income and operating income must also be presented. This reconciliation is not required under IFRS.
- Presentation: The three categories—Cash Flows from Operating Activities, Cash Flows from Investing Activities, and Cash Flows from Financing Activities—are required under both US GAAP and IFRS. US GAAP requires the presentation of only one year of information, while IFRS requires two years of data.
- Categorizing Transactions: IFRS is more flexible in where to present certain cash flow transactions than is US GAAP. This flexibility occurs around interest, dividends, and taxes. As shown in (Figure), US GAAP is more rigid in reporting.
| Comparing GAAP and IFRS | ||
|---|---|---|
| US GAAP | IFRS | |
| Interest paid | Operating | Operating or financing |
| Interest received | Operating | Operating or investing |
| Dividends paid | Financing | Operating or financing |
| Dividends received | Operating | Operating or investing |
| Taxes | Operating | Usually operating but option to dissect tax into operating and financing components |
Understanding the impact of these potential differences is important. The statement of cash flows is used not only to evaluate from where a company receives and spends its cash, but also to predict future cash flows. The flexibility of these reporting items in the statement of cash flows can result in decreased comparability between similar companies using different reporting methods. For example, Free Cash Flow (Operating Cash Flows less Capital Expenditures), will have different results if interest and dividends are classified in sections other than operating activities.
Let’s consider an example: World-Wide Co. is headquartered in London and currently reports under US GAAP because it is traded on the New York Stock Exchange (NYSE). World-Wide is considering switching to reporting under IFRS to make the company more comparable to its competitors, since most of them use IFRS. World-Wide has the following information in the operating activities section of its most recent statement of cash flows.
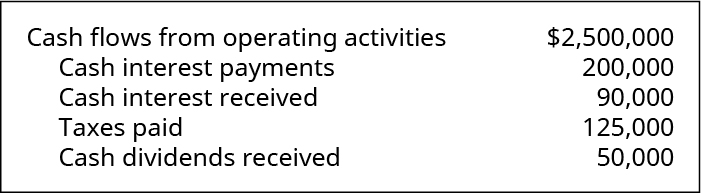
World-Wide had $1,000,000 in capital expenditures during the year, and they paid dividends of $80,000 to shareholders.
Based on this information, World-Wide’s Free Cash Flow would be as follows:

or
$2,500,000 − $1,000,000 = $1,500,000
If World-Wide switches to IFRS reporting, it has determined that its cash interest payments would be classified as financing activities because the payments are related to long-term debt. The interest received is from a short-term receivable and thus will remain classified as an operating activity, but the dividends received are from a long-term investment and will be reclassified to an investing activity. And, $60,000 of the taxes have been identified as being associated with tax consequences of an investing opportunity and therefore will be reclassified as an investing activity. With these reclassifications, the free cash flow of World-Wide would be as follows:
FCF = ($2,500,000 + $200,000 − $50,000 + $60,000) − 1,000,000 = $1,710,000
The take-away from this example is that the flexibility afforded by IFRS can have an impact on comparability between companies.
These, and other differences, between US GAAP and IFRS arise because of the more rules-based nature of the standards put forth by FASB versus the more principles-based rules set forth by IASB. The IASB, in creating IFRS standards, follows a substance-over-form viewpoint that allows firms more flexibility in assessing the intent of transactions. Anytime more judgement is allowed and/or utilized, there must be adequate disclosure to explain the chosen reporting methodology.
Key Concepts and Summary
- Free cash flow relates to the amount of expected cash from operations which is left over after planned capital expenditures and dividends are paid.
- The cash flow to assets ratio correlates the company’s free cash flow to its total asset value.
- The cash flow to sales ratio considers free cash flow in relation to the company’s sales revenue.
Multiple Choice
(Figure)Which of the following is a stronger indicator of cash flow flexibility?
- cash flow from operating activities
- cash flow to sales ratio
- free cash flow
- all three indicate comparable degrees of flexibility
C
Questions
(Figure)What insight does the calculation of free cash flow provide about the company’s cash flow position?
Exercise Set A
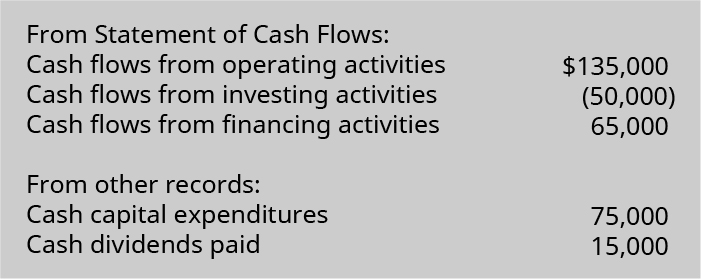
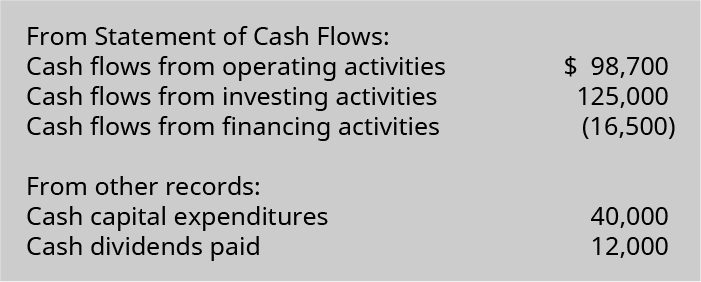
(Figure)Use the following excerpts from Kirsten Company’s Statement of Cash Flows and other financial records to determine the company’s free cash flow.
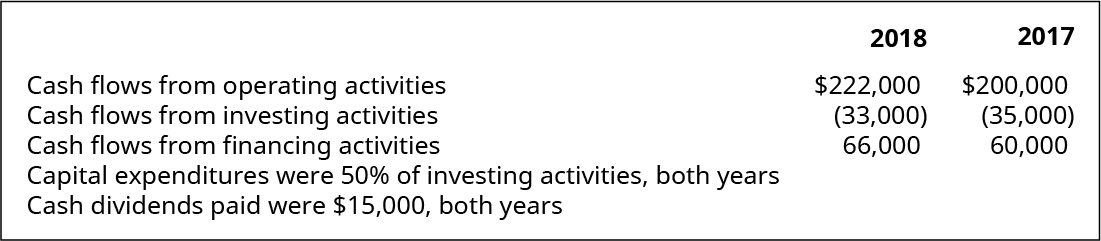
(Figure)Use the following excerpts from Franklin Company’s statement of cash flows and other financial records to determine the company’s free cash flow for 2018 and 2017.
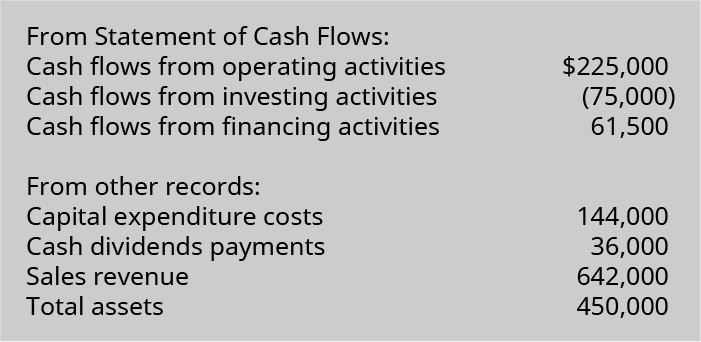
(Figure)The following are excerpts from Hamburg Company’s statement of cash flows and other financial records.

Compute the following for the company:
- free cash flow
- cash flows to sales ratio
- cash flows to assets ratio
Exercise Set B
(Figure)Use the following excerpts from Indira Company’s Statement of Cash Flows and other financial records to determine the company’s free cash flow.
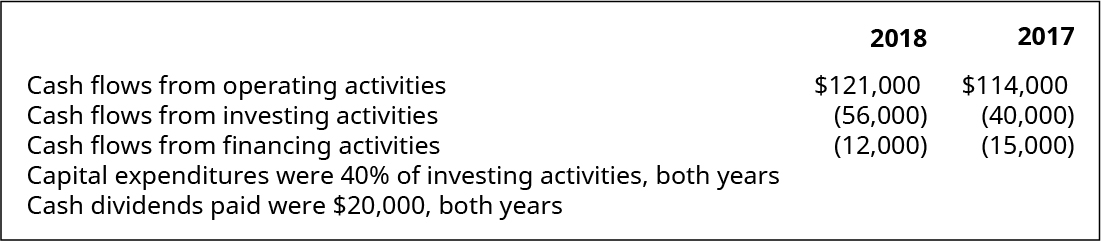
(Figure)Use the following excerpts from Bolognese Company’s statement of cash flows and other financial records to determine the company’s free cash flow for 2018 and 2017.
(Figure)The following shows excerpts from Camole Company’s statement of cash flows and other financial records.
Compute the following for the company:
- free cash flow
- cash flows to sales ratio
- cash flows to assets ratio
Problem Set A
(Figure)The following shows excerpts from financial information relating to Aspen Company and Bergamot Company.
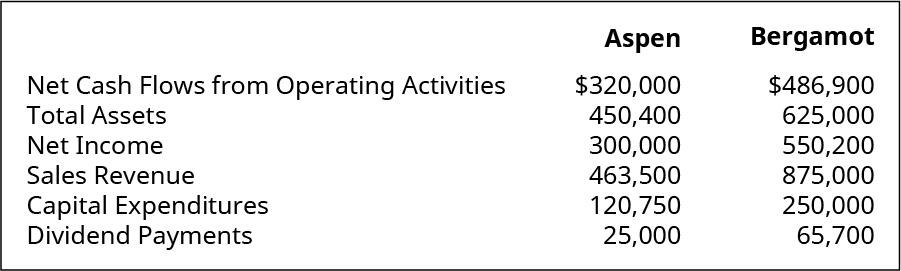
Compute the following for both companies. Compare your results.
- free cash flow
- cash flows to sales ratio
- cash flows to assets ratio
Problem Set B
(Figure)The following shows excerpts from financial information relating to Stanwell Company and Thodes Company.
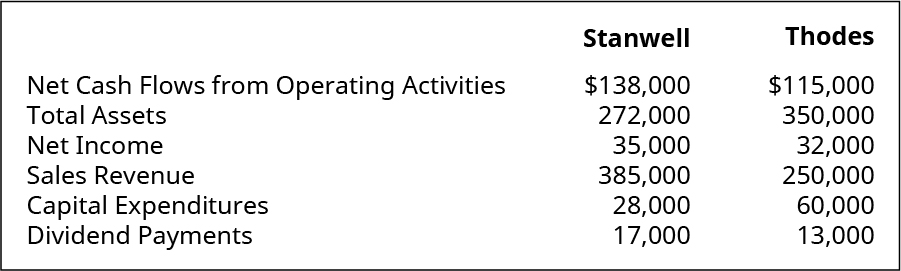
Compute the following for both companies. Compare your results.
- free cash flow
- cash flows to sales ratio
- cash flows to assets ratio
Thought Provokers
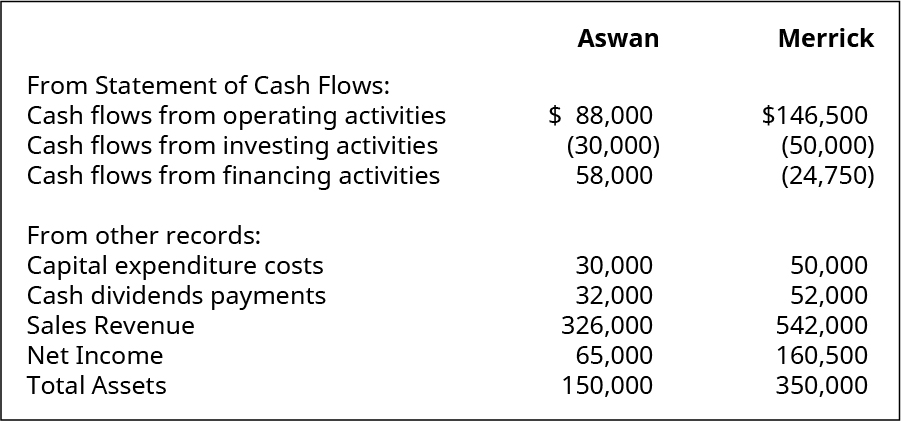
(Figure)If you had $100,000 available for investing, which of these companies would you choose to invest with? Support your answer with analysis of free cash flow, based on the data provided, and include in your decision whatever other reasoning you chose to utilize.
Footnotes
- 1 Marc A. Siegel. “Accounting Shenanigans on the Cash Flow Statement.” CPA Journal. March 2006. http://archives.cpajournal.com/2006/306/essentials/p38.htm
- 2 Steven D. Jones. “Why Cash Flow Matters in Evaluating a Company.” The Wall Street Journal. August 11, 2016. https://www.wsj.com/articles/SB997466275287616386. Miriam Gottfried. “Spoiler Alert for Netflix: Debt and Cash Flow Matter.” The Wall Street Journal. April 17, 2017. https://www.wsj.com/articles/spoiler-alert-for-netflix-debt-and-cash-flow-matter-1492468397
Glossary
- free cash flow to assets ratio
- ratio of free cash flow to total assets
- free cash flow
- operating cash, reduced by expected capital expenditures and by cash dividends payments
- free cash flow to sales ratio
- ratio of free cash flow to sales revenue
