
LO 13.5 Discuss the Applicability of Earnings per Share as a Method to Measure Performance
Mitchell Franklin
Earnings per share (EPS) measures the portion of a corporation’s profit allocated to each outstanding share of common stock. Many financial analysts believe that EPS is the single most important tool in assessing a stock’s market price. A high or increasing earnings per share can drive up a stock price. Conversely, falling earnings per share can lower a stock’s market price. EPS is also a component in calculating the price-to-earnings ratio (the market price of the stock divided by its earnings per share), which many investors find to be a key indicator of the value of a company’s stock.
While a company’s board of directors makes the final approval of the reports, a key goal of each company is to look favorable to investors while providing financial statements that accurately reflect the financial condition of the company. Each quarter, public companies report EPS through a public announcement as one of the key measures of their profitability. These announcements are highly anticipated by investors and analysts. The suspense is heightened because analysts provide earnings estimates to the public prior to each announcement release. According to Matt Weinberger of Business Insider, the announcement by Microsoft of its first quarter 2018 EPS reported at ?0.95 per share, higher than analysts’ estimates of ?0.85 per share, caused the value of its stock to rise by more than 3% within hours of the announcement.1 While revenue was the other key metric in Microsoft’s earnings announcement, EPS carried more weight in the surge of the company’s market price.
Calculating Earnings per Share
Earnings per share is the profit a company earns for each of its outstanding common shares. Both the balance sheet and income statement are needed to calculate EPS. The balance sheet provides details on the preferred dividend rate, the total par value of the preferred stock, and the number of common shares outstanding. The income statement indicates the net income for the period. The formula to calculate basic earnings per share is:

By removing the preferred dividends from net income, the numerator represents the profit available to common shareholders. Because preferred dividends represent the amount of net income to be distributed to preferred shareholders, this portion of the income is obviously not available for common shareholders. While there are a number of variations of measuring a company’s profit used in the financial world, such as NOPAT (net operating profit after taxes) and EBITDA (earnings before interest, taxes, depreciation, and amortization), GAAP requires companies to calculate EPS based on a corporation’s net income, as this amount appears directly on a company’s income statement, which for public companies must be audited.
In the denominator, only common shares are used to determine earnings per share because EPS is a measure of earnings for each common share of stock. The denominator can fluctuate throughout the year as a company issues and buys back shares of its own stock. The weighted average number of shares is used on the denominator because of this fluctuation. To illustrate, assume that a corporation began the year with 600 shares of common stock outstanding and then on April 1 issued 1,000 more shares. During the period January 1 to March 31, the company had the original 600 shares outstanding. Once the new shares were issued, the company had the original 600 plus the new 1,000 shares, for a total of 1,600 shares for each of the next nine months—from April 1 to December 31. To determine the weighted average shares, apply these fractional weights to both of the stock amounts, as shown in (Figure).
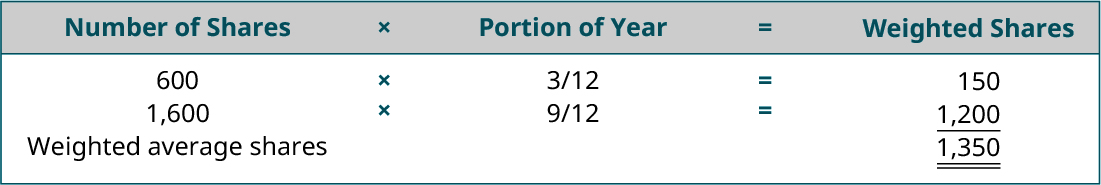
If the shares were not weighted, the calculation would not consider the time period during which the shares were outstanding.
To illustrate how EPS is calculated, assume Sanaron Company earns ?50,000 in net income during 2020. During the year, the company also declared a ?10,000 dividend on preferred stock and a ?14,000 dividend on common stock. The company had 5,000 common shares outstanding the entire year along with 2,000 preferred shares. Sanaron has generated ?8 of earnings (?50,000 less the ?10,000 of preferred dividends) for each of the 5,000 common shares of stock it has outstanding.
When a company issued new shares of stock and buys other back as treasury stock, EPS can be manipulated because both of these transactions affect the number of shares of stock outstanding. What are ethical considerations involved in calculating EPS?
Measuring Performance with EPS
EPS is a key profitability measure that both current and potential common stockholders monitor. Its importance is accentuated by the fact that GAAP requires public companies to report EPS on the face of a company’s income statement. This is only ratio that requires such prominent reporting. If fact, public companies are required to report two different earnings per share amounts on their income statements—basic and diluted. We’ve illustrated the calculation of basic EPS. Diluted EPS, which is not demonstrated here, involves the consideration of all securities such as stocks and bonds that could potentially dilute, or reduce, the basic EPS.
Where can you find EPS information on public companies? Check out the Yahoo Finance website and search for EPS data for your favorite corporation.
Common stock shares are normally purchased by investors to generate income through dividends or to sell at a profit in the future. Investors realize that inadequate EPS can result in poor or inconsistent dividend payments and fluctuating stock prices. As such, companies seek to produce EPS amounts that rise each period. However, an increase in EPS may not always reflect favorable performance, as there are multiple reasons that EPS may increase. One way EPS can increase is because of increased net income. On the other hand, it can also increase when a company buys back its own shares of stock. For example, assume that Ranadune Enterprises generated net income of ?15,000 in 2020. In addition, 20,000 shares of common stock and no preferred stock were outstanding throughout 2020. On January 1, 2020, the company buys back 2,500 shares of its common stock and holds them as treasury shares. Net income for 2020 stayed static at ?15,000. Just before the repurchasing of the stock, the company’s EPS is ?0.75 per share:
The purchase of treasury stock in 2020 reduces the common shares outstanding to 17,500 because treasury shares are considered issued but not outstanding (20,000 − 2,500). EPS for 2020 is now ?0.86 per share even though earnings remains the same.
This increase in EPS occurred because the net income is now spread over fewer shares of stock. Similarly, EPS can decline even when a company’s net income increases if the number of shares increases at a higher degree than net income. Unfortunately, managers understand how the number of shares outstanding can affect EPS and are often in position to manipulate EPS by creating transactions that target a desired EPS number.
Public companies can increase their earnings per share by buying their own stock in the open market. The increase in earnings per share results because the number of shares is reduced by the purchase even though the earnings remain the same. With fewer shares and the same amount of earnings, the earnings per share increases without any change in overall profitability or operational efficiency. A Market Watch article attributing Goldman Sachs states, “S&P 500 companies will spend about ?780 billion on share buybacks in 2017, marking a 30% rise from 2016.”2 An article in Forbes provides some perspective by pointing out that buying back shares was legalized in 1982, but for the majority of the twentieth century, corporate buybacks of shares was considered illegal because “they were thought to be a form of stock market manipulation. . . . Buying back company stock can inflate a company’s share price and boost its earnings per share—metrics that often guide lucrative executive bonuses.”3 Is a corporation buying back its shares an ethical way in which to raise or maintain the price of a company’s shares?
Earnings per share is interpreted differently by different analysts. Some financial experts favor companies with higher EPS values. The reasoning is that a higher EPS is a reflection of strong earnings and therefore a good investment prospect. A more meaningful analysis occurs when EPS is tracked over a number of years, such as when presented in the comparative income statements for Cracker Barrel Old Country Store, Inc.’s respective year ends in 2017, 2016, and 2015 shown in (Figure).4Cracker Barrel’s basic EPS is labeled as “net income per share: basic.”
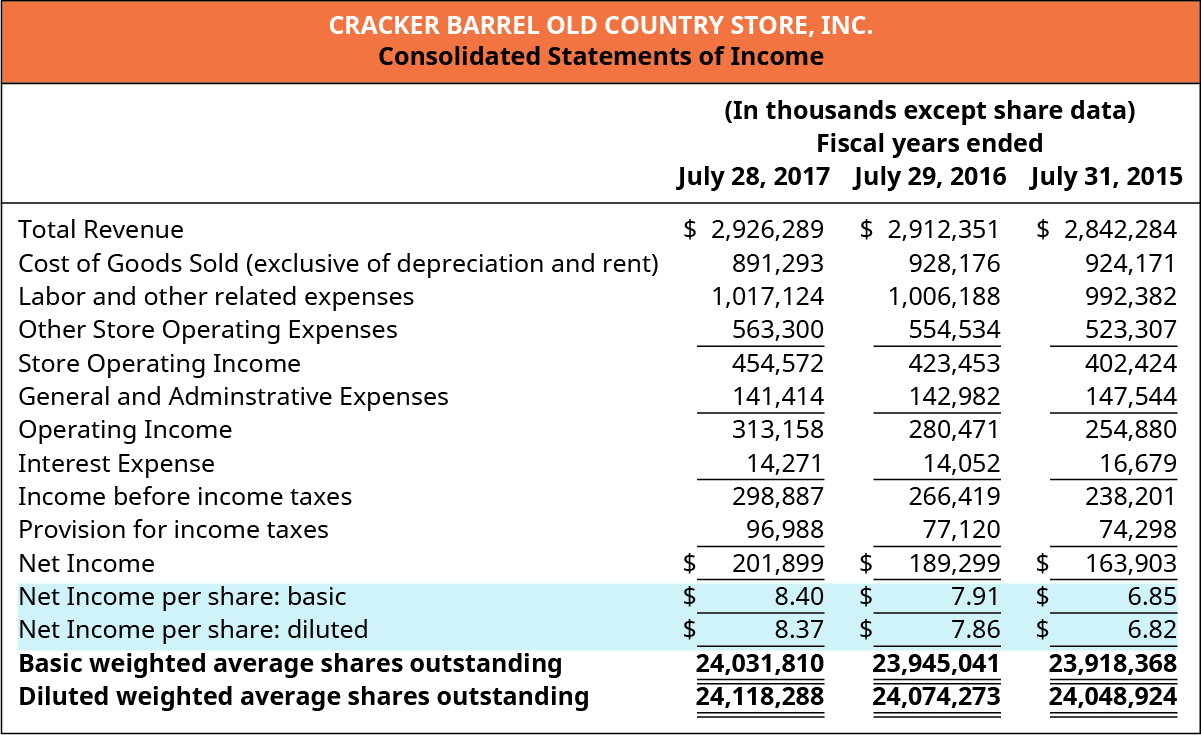
Most analysts believe that a consistent improvement in EPS year after year is the indication of continuous improvement in the earning power of a company. This is what is seen in Cracker Barrel’s EPS amounts over each of the three years reported, moving from ?6.85 to ?7.91 to ?8.40. However, it is important to remember that EPS is calculated on historical data, which is not always predictive of the future. In addition, when EPS is used to compare different companies, significant differences may exist. If companies are in the same industry, that comparison may be more valuable than if they are in different industries. Basically, EPS should be a tool used in decision-making, utilized alongside other analytic tools.
What if, in 1997, you invested ?5,000 in Amazon? Today, your investment would be worth nearly ?1 million. Potential investors viewing Amazon’s income statement in 1997 would have seen an EPS of a negative ?0.11. In other words, Amazon lost ?0.11 for each share of common stock outstanding. Would you have invested?
Solution
Answers will vary. A strong response would include the idea that a negative or small EPS reflects upon the past historical operations of a company. EPS does not predict the future. Investors in 1997 looked beyond Amazon’s profitability and saw its business model having strong future potential.
As a valued employee, you have been awarded 10 shares of the company’s stock. Congratulations! How could you use earnings per share to help you decide whether to hold on to the stock or keep it for the future?
Key Concepts and Summary
- Earnings per share (EPS) measures the portion of a corporation’s profit allocated to each outstanding share of common stock.
- EPS is calculated by dividing the profit earned for common shareholders by the weighted average common shares of stock outstanding.
- Because EPS is a key profitability measure that both current and potential common stockholders monitor, it is important to understand how to interpret it.
Multiple Choice
(Figure)Which of the following is a measurement of earnings that represents the profit before interest, taxes, depreciation and amortization are subtracted?
- net income
- retained earnings
- EBITDA
- EPS
(Figure)Which of the following measures the portion of a corporation’s profit allocated to each outstanding share of common stock?
- retained earnings
- EPS
- EBITDA
- NOPAT
B
(Figure)The measurement of earnings concept that consists of a company’s profit from operations after taxed are subtracted is ________.
- ROI
- EPS
- EBITDA
- NOPAT
(Figure)The correct formula for the calculation of earnings per share is ________.
- (Net income + Preferred dividends) / Weighted average common shares outstanding
- Net income / Weighted average common shares outstanding
- (Net income – Preferred dividends) / Weighted average common shares outstanding
- (Net income – Preferred dividends) / Treasury shares outstanding
C
(Figure)Most analysts believe which of the following is true about EPS?
- Consistent improvement in EPS year after year is the indication of continuous improvement in the company’s earning power.
- Consistent improvement in EPS year after year is the indication of continuous decline in the company’s earning power.
- Consistent improvement in EPS year after year is the indication of fraud within the company.
- Consistent improvement in EPS year after year is the indication that the company will never suffer a year of net loss rather than net income.
Questions
(Figure)Which financial statements do you need to calculate EPS?
Comparative balance sheets and income statements.
(Figure)Where is EPS disclosed for publicly traded companies?
(Figure)Should investors rely on EPS as an investing tool? Why or why not?
Yes, as one analytical tool among others.
(Figure)What information do you need to calculate the weighted average common shares outstanding?
(Figure)Which is the only ratio required to be reported on the face of a company’s financial statements? What are the two ways the ratio is required to be reported?
EPS is the only ratio required by GAAP to be reported on the face of the income statement. It must be reported in two ways: basic and diluted (if applicable).
Exercise Set A
(Figure)Jupiter Corporation earned net income of ?90,000 this year. The company began the year with 600 shares of common stock and issued 500 more on April 1. They issued ?5,000 in preferred dividends for the year. What is Jupiter Corporation’s weighted average number of shares for the year?
(Figure)Longmont Corporation earned net income of ?90,000 this year. The company began the year with 600 shares of common stock and issued 500 more on April 1. They issued ?5,000 in preferred dividends for the year. What is the numerator of the EPS calculation for Longmont?
(Figure)James Corporation earned net income of ?90,000 this year. The company began the year with 600 shares of common stock and issued 500 more on April 1. They issued ?5,000 in preferred dividends for the year. What is the EPS for the year for James (rounded to the nearest dollar)?
Exercise Set B
(Figure)Brunleigh Corporation earned net income of ?200,000 this year. The company began the year with 10,000 shares of common stock and issued 5,000 more on April 1. They issued ?7,500 in preferred dividends for the year. What is Brunleigh Corporation’s weighted average number of shares for the year?
(Figure)Errol Corporation earned net income of ?200,000 this year. The company began the year with 10,000 shares of common stock and issued 5,000 more on April 1. They issued ?7,500 in preferred dividends for the year. What is the numerator of the EPS calculation for Errol?
(Figure)Bastion Corporation earned net income of ?200,000 this year. The company began the year with 10,000 shares of common stock and issued 5,000 more on April 1. They issued ?7,500 in preferred dividends for the year. What is the EPS for the year for Bastion?
Problem Set A
(Figure)You have some funds that you would like to invest. Do some internet research to find two publicly traded companies in the same industry and compare their earnings per share. Would the earnings per share reported by each company influence your decision in selecting which company to invest in?
(Figure)You are a consultant working with various companies that are considering incorporating and listing shares on a stock exchange. Explain the importance of the EPS calculation to financial analysts who follow companies on the stock exchanges.
Problem Set B
(Figure)You have some funds that you would like to invest and you are relying heavily on the EPS calculation to help you make your decision. Initially you are baffled about why preferred dividends are subtracted in the numerator and why a weighted average is used in the denominator, so you do some research and reflection and come to understand why. Your friend is interested in hearing about your thought process. How would you explain to your friend why it’s important to subtract preferred dividends and to use weighted averages?
(Figure)You are a consultant working with various companies that are considering incorporating and listing shares on a stock exchange. One of your clients asks you about the various acronyms she has been hearing in conjunction with financial analysis. Explain the following acronyms and how they measure different things but may complement each other: EPS (earnings per share), EBITDA (earnings before interest, taxes, depreciation, and amortization), and NOPAT (net operating profit after taxes).
Footnotes
- 1Matt Weinberger. “Microsoft’s Cloud Business Is Driving a Revenue Surge That’s Well above Wall Street Targets.” Business Insider. April 26, 2018. https://www.businessinsider.com/microsoft-q3-fy18-earnings-revenue-eps-analysis-2018-4
- 2C. Linnane and T. Kilgore. “Share Buybacks Will Rise 30% to ?780 Billion Next Year, says Goldman Sachs.” Market Watch. November 22, 2016 https://www.marketwatch.com/story/share-buybacks-will-return-with-a-vengeance-next-year-2016-11-21.
- 3Arne Alsin. “The Ugly Truth Behind Stock Buybacks.” Forbes. Feb. 28, 2017. https://www.forbes.com/sites/aalsin/2017/02/28/shareholders-should-be-required-to-vote-on-stock-buybacks/#69b300816b1e
- 4Cracker Barrel. Cracker Barrel Old Country Store 2017 Annual Report. September 22, 2017. http://investor.crackerbarrel.com/static-files/c05f90b8-1214-4f50-8508-d9a70301f51f
Glossary
- earnings per share (EPS)
- measurement of the portion of a corporation’s profit allocated to each outstanding share of common stock
