
Chapter 3 LO 4 — Perform Break-Even Sensitivity Analysis for a Multi-Product Environment Under Changing Business Situations
Up to this point in our CVP analysis, we have assumed that a company only sells one product, but we know that, realistically, this is not the case. Most companies operate in a multi-product environment, in which they sell different products, manufacture different products, or offer different types of services. Companies price each one of their products or services differently, and the costs associated with each of those products or services vary as well. In addition, companies have limited resources, such as time and labor, and must decide which products to sell or produce and in what quantities, or which services to offer in order to be the most profitable. These profitability considerations are often what contributes substance to a sales mix decision
The Basics of Break-Even Analysis in a Multi-Product Environment
In order to perform a break-even analysis for a company that sells multiple products or provides multiple services, it is important to understand the concept of a sales mix. A sales mix represents the relative proportions of the products that a company sells—in other words, the percentage of the company’s total revenue that comes from product A, product B, product C, and so forth. Sales mix is important to business owners and managers because they seek to have a mix that maximizes profit, since not all products have the same profit margin. Companies can maximize their profits if they are able to achieve a sales mix that is heavy with high-margin products, goods, or services. If a company focuses on a sales mix heavy with low-margin items, overall company profitability will often suffer.
Performing a break-even analysis for these multi-product businesses is more complex because each product has a different selling price, a different variable cost, and, ultimately, a different contribution margin. We must also proceed under the assumption that the sales mix remains constant; if it does change, the CVP analysis must be revised to reflect the change in sales mix. For the sake of clarity, we will also assume that all costs are companywide costs, and each product contributes toward covering these companywide costs.
THINK IT THROUGH
You are the manager of a sub shop located near a college campus. The college has recently added a fast-food style café to the student center, which has reduced the number of students eating at your restaurant. Your highest margin items are drinks (a contribution margin of approximately 90%) and vegetarian subs (a contribution margin of approximately 75%). How can you use CVP analysis to help you compete with the college’s café? What would you suggest as possible ways to increase business while maintaining target income levels?
Calculating Break-Even Analysis in a Multi-Product Environment
When a company sells more than one product or provides more than one service, break-even analysis is more complex because not all of the products sell for the same price or have the same costs associated with them: Each product has its own margin. Consequently, the break-even point in a multi-product environment depends on the mix of products sold. Further, when the mix of products changes, so does the break-even point. If demand shifts and customers purchase more low-margin products, then the break-even point rises. Conversely, if customers purchase more high-margin products, the break-even point falls. In fact, even if total sales dollars remain unchanged, the break-even point can change based on the sales mix. Let’s look at an example of how break-even analysis works in a multi-product environment.
We will consider Smile! Inc. for an example of a multi-product break-even analysis. Smile! Inc. manufactures and sells 3 types of porch cameras, Knock-Knock, Ding-Dong, and Buzz-zzz, each with its own sales price, variable cost, and contribution margin, as shown:

The sales mix for Smile! Inc. is 50.00% of units sold are Knock-Knocks, 33.33% are Ding-Dongs, and 16.67% are Buzz-zzz’s. We will assume for now that Smile! Inc. continues to sell the three products in the same proportions. Smile! Inc.’s fixed costs are $230,000 per year.
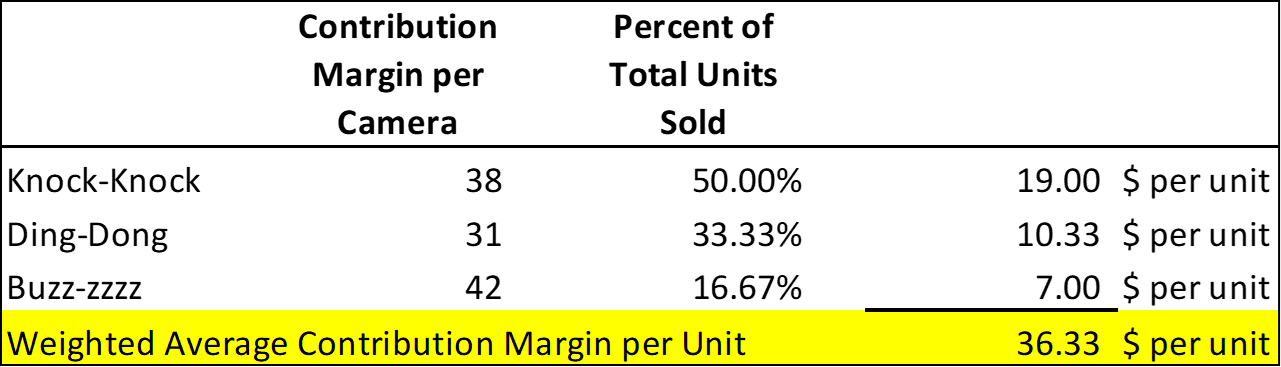
Because each of the 3 products has a different contribution margin per camera, we need to calculate the weighted average contribution margin for the combined products.

Applying the formula, we determine that 38$ per unit X 50.00% + 31$ per unit X 33.33% + 42$ per unit X 16.67% = 36.33$ per unit weighted average contribution margin.
We then use the weighted average contribution margin per unit to determine Smile! Inc.’s break-even point:
Break-Even Point (units) = Total fixed costs divided by Weighted average contribution margin per unit
$230,000 divided by 36.33$ per unit = 6,331 units (cameras)
Smile! Inc. will break even when it sells 6,331 cameras. To determine how many of each model Smile! Inc. needs to sell, we apply each model’s sales mix percentage to the break-even quantity as follows:

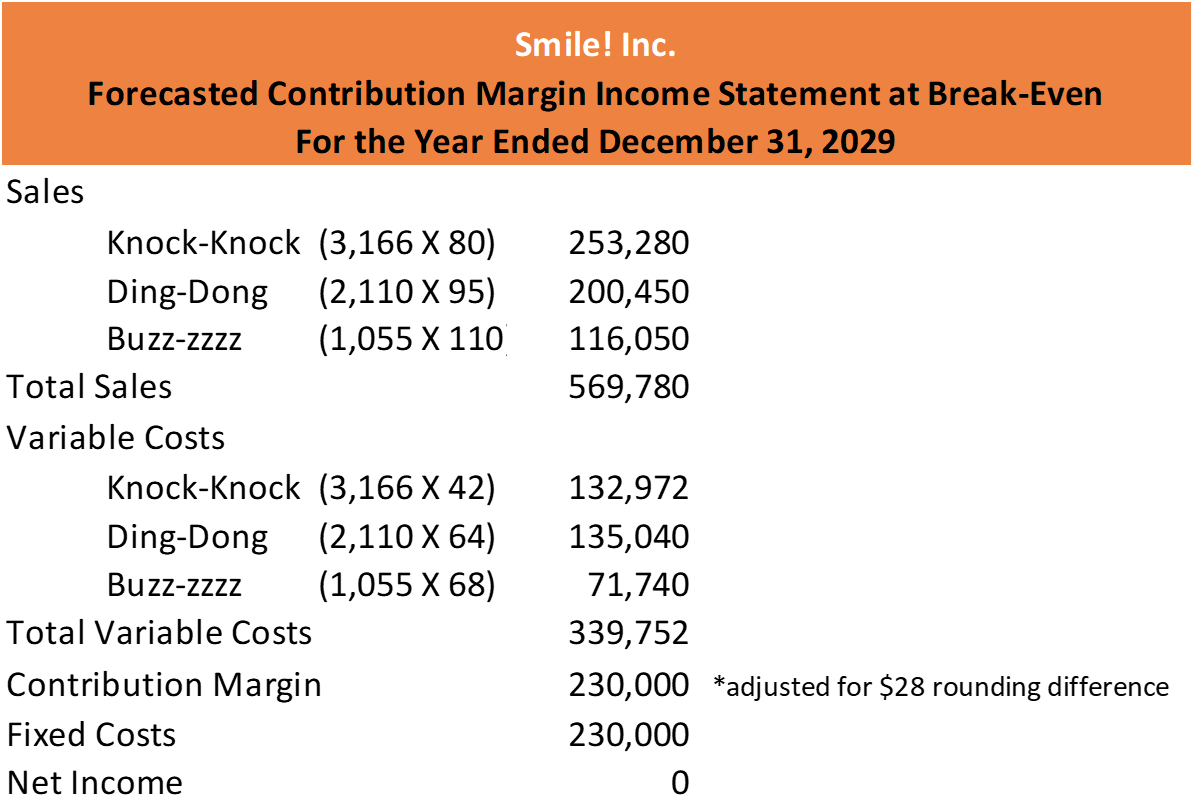
Using a forecasted or estimated contribution margin income statement, we can verify that the quantities listed will place Smile! Inc. at break-even.
Smile! Inc. can use this CVP analysis for a wide range of business decisions and for planning purposes. Remember, however, that if the sales mix changes from its current ratio, then the break-even point will change. For planning purposes, Smile! Inc. can change the sales mix, sales price, or variable cost of one or more of the products in the mix and perform a “what-if” analysis.
YOUR TURN
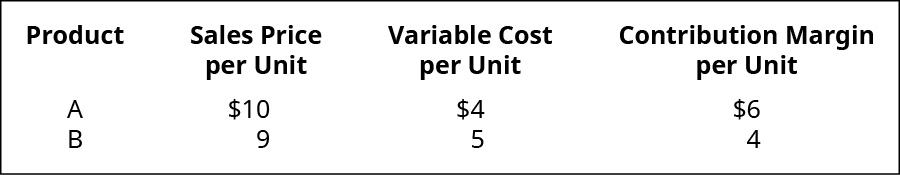
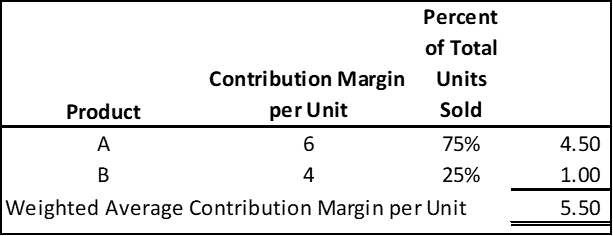
The sales mix of a company selling two products, A and B, is 75% and 25% respectively. The per-unit variable costs is $4 for Product A and $5 for Product B. Product A sells for $10 and product B sells for $9. Fixed costs for the company are $220,000.
- What is the weighted average contribution margin for the two products?
- What is the break-even point in units?
- How many units of product A and product B will the company sell at the break-even point?
Solution
1.
2. Break-even point in units sold: Fixed Costs $220,000 divided by 5.50$ per unit = 40,000 units
3.

KEY TAKEAWAYS
Key Concepts and Summary
- Companies provide multiple products, goods, and services to the consumer and, as result, need to calculate their break-even point based on the mix of the products, goods, and services.
- In a multi-product environment, calculating the break-even point is more complex and is usually calculated using a weighted average contribution margin, which represents the sales mix of the business.
- If the sales mix of a company changes, then the break-even point changes, regardless of whether total sales dollars change or not.
Glossary
- composite unit
- selection of discrete products associated together in relation or proportion to their sales mix
- multi-product environment
- business environment in which a company sells different products, manufactures different products, or offers different types of services
- sales mix
- relative proportions of the products that a company sells
