Exercise Answers: Module 44

1. slope m=4 and y-intercept \left(0,-2\right) 3. slope m=-3 and y-intercept \left(0,1\right)
5. slope m=-\dfrac{2}{5} and y-intercept \left(0,3\right) 7. -9;\left(0,7\right)
9. 4;\left(0,-10\right) 11. -4;\left(0,8\right)
13. -\dfrac{8}{3};\left(0,4\right) 15. \dfrac{7}{3};\left(0,-3\right)
17.

The figure shows a line graphed on the x y-coordinate plane. The x-axis of the plane runs from negative 10 to 10. The y-axis of the plane runs from negative 10 to 10. The line goes through the points (0, 4) and (1, 5).

19.

The figure shows a line graphed on the x y-coordinate plane. The x-axis of the plane runs from negative 10 to 10. The y-axis of the plane runs from negative 10 to 10. The line goes through the points (0, negative 3) and (1, negative 1).

21.

The figure shows a line graphed on the x y-coordinate plane. The x-axis of the plane runs from negative 10 to 10. The y-axis of the plane runs from negative 10 to 10. The line goes through the points (0, 3) and (1, 2).

23.

The figure shows a line graphed on the x y-coordinate plane. The x-axis of the plane runs from negative 10 to 10. The y-axis of the plane runs from negative 10 to 10. The line goes through the points (0, negative 2) and (1, negative 3).

25.

The figure shows a line graphed on the x y-coordinate plane. The x-axis of the plane runs from negative 10 to 10. The y-axis of the plane runs from negative 10 to 10. The line goes through the points (0, negative 3) and (5, negative 5).

27.

The figure shows a line graphed on the x y-coordinate plane. The x-axis of the plane runs from negative 10 to 10. The y-axis of the plane runs from negative 10 to 10. The line goes through the points (0,1) and (3, negative 1).

29.

The figure shows a line graphed on the x y-coordinate plane. The x-axis of the plane runs from negative 10 to 10. The y-axis of the plane runs from negative 10 to 10. The line goes through the points (0, negative 2) and (3,2).

31.

The figure shows a line graphed on the x y-coordinate plane. The x-axis of the plane runs from negative 10 to 10. The y-axis of the plane runs from negative 10 to 10. The line goes through the points (0, 25) and (negative 50, 10).

33. horizontal line 35. vertical line
37. slope–intercept 39. intercepts
41. slope–intercept 43. horizontal line
45. intercepts 47. slope–intercept
49.

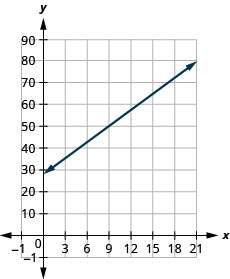
a) $28

b) $66.10

c) The slope, 2.54, means that Randy’s payment, P, increases by $2.54 when the number of units of water he used, w, increases by 1. The P–intercept means that if the number units of water Randy used was 0, the payment would be $28.

d)
The figure shows a line graphed on the x y-coordinate plane. The x-axis of the plane represents the variable w and runs from negative 2 to 20. The y-axis of the plane represents the variable P and runs from negative 1 to 100. The line begins at the point (0, 28) and goes through the point (15, 66.1).

51.

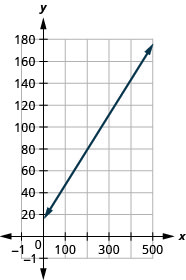
a) $15

b) $143

c) The slope, 0.32, means that the cost, C, increases by $0.32 when the number of miles driven, m, increases by 1. The C-intercept means that if Janelle drives 0 miles one day, the cost would be $15.

d)
The figure shows a line graphed on the x y-coordinate plane. The x-axis of the plane represents the variable m and runs from negative 1 to 500. The y-axis of the plane represents the variable C and runs from negative 1 to 200. The line begins at the point (0,15) and goes through the point (400,143).

53.

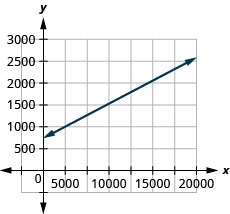
a) $750

b) $2418.60

c) The slope, 0.09, means that Patel’s salary, S, increases by $0.09 for every $1 increase in his sales. The S-intercept means that when his sales are $0, his salary is $750.

d)
The figure shows a line graphed on the x y-coordinate plane. The x-axis of the plane represents the variable w and runs from negative 1 to 20000. The y-axis of the plane represents the variable P and runs from negative 1 to 3000. The line begins at the point (0, 750) and goes through the point (18540, 2415).

55.

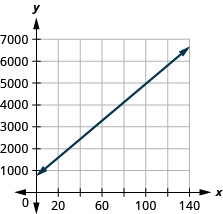
a) $2850

b) $4950

c) The slope, 42, means that the cost, C, increases by $42 for when the number of guests increases by 1. The C-intercept means that when the number of guests is 0, the cost would be $750.

d)
The figure shows a line graphed on the x y-coordinate plane. The x-axis of the plane represents the variable g and runs from negative 1 to 150. The y-axis of the plane represents the variable C and runs from negative 1 to 7000. The line begins at the point (0, 750) and goes through the point (100, 4950).

57. parallel 59. parallel
61. parallel 63. parallel
65. parallel 67. parallel
69. parallel 71. parallel
73. not parallel 75. not parallel
77. not parallel 79. not parallel
81. not parallel 83. perpendicular
85. perpendicular 87. not perpendicular
89. not perpendicular 91. perpendicular
93. perpendicular 95.

a) For every increase of one degree Fahrenheit, the number of chirps increases by four.

b) There would be -160 chirps when the Fahrenheit temperature is 0°. (Notice that this does not make sense; this model cannot be used for all possible temperatures.)

97. Answers will vary.

License

Icon for the Creative Commons Attribution-NonCommercial-ShareAlike 4.0 International License

Technical Math with Algebra Copyright © 2022 by Claire Elliott is licensed under a Creative Commons Attribution-NonCommercial-ShareAlike 4.0 International License, except where otherwise noted.

Share This Book