
Chapter 5: Carbohydrates
5.5 Carbohydrates and Blood Glucose Levels
Maintaining Blood Glucose Levels: The Pancreas and Liver
Glucose levels in the blood are tightly controlled, as having either too much or too little glucose in the blood can have health consequences. Hyperglycemia is when blood glucose levels are higher than normal. Hyperglycemia is usually associated with diabetes, but it can occur in response to medications or other health conditions. If hyperglycemia is left untreated, high blood sugar levels can damage nerves, blood vessels, and other organs.[1] Hypoglycemia is when blood glucose levels are lower than normal. Hypoglycemia can lead to feelings of tiredness, anxiety, or irritability, and if not treated, can progress to seizures and lack of consciousness, as the brain is unable to function without glucose as an energy source.[2]
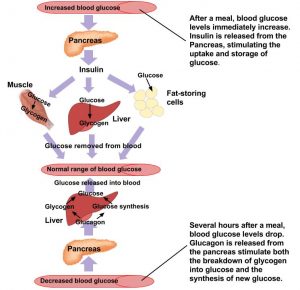
Glucose regulates its levels in the blood via a process called negative feedback. An everyday example of negative feedback is in your oven because it contains a thermostat. When you set the temperature to cook a delicious homemade noodle casserole at 375°F the thermostat senses the temperature and sends an electrical signal to turn the elements on and heat up the oven. When the temperature reaches 375°F the thermostat senses the temperature and sends a signal to turn the element off. Similarly, your body senses blood glucose levels and maintains the glucose “temperature” in the target range. The glucose thermostat is located within the cells of the pancreas. After eating a meal containing carbohydrates glucose levels rise in the blood.
Insulin-secreting cells in the pancreas sense the increase in blood glucose and release the hormone, insulin, into the blood. Insulin sends a signal to the body’s cells to remove glucose from the blood by transporting it into different organ cells around the body and using it to make energy. In the case of muscle tissue and the liver, insulin sends the biological message to store glucose away as glycogen. The presence of insulin in the blood signifies to the body that glucose is available for fuel. As glucose is transported into the cells around the body, the blood glucose levels decrease. Insulin has an opposing hormone called glucagon. Glucagon-secreting cells in the pancreas sense the drop in glucose and, in response, release glucagon into the blood. Glucagon communicates to the cells in the body to stop using all the glucose. More specifically, it signals the liver to break down glycogen and release the stored glucose into the blood, so that glucose levels stay within the target range and all cells get the needed fuel to function properly.
A Carbohydrate Feast
You are at a your grandma’s house for family dinner and you just consumed turkey, mashed potatoes and gravy, cranberry sauce, and a hot sweet bread roll dripping with butter. Less than an hour later you top it off with a slice of pumpkin pie and then lie down on the couch to watch TV. The “hormone of plenty,” insulin, answers the nutrient call. Insulin sends out the physiological message that glucose is abundant in the blood, so that cells can absorb it and either use it or store it. The result of this hormone message is maximization of glycogen stores and all the excess glucose, protein, and lipids are stored as fat.
A typical American Thanksgiving meal contains many foods that are dense in carbohydrates, with the majority of those being simple sugars and starches. These types of carbohydrate foods are rapidly digested and absorbed. Blood glucose levels rise quickly causing a spike in insulin levels. Contrastingly, foods containing high amounts of fiber are like time-release capsules of sugar. A measurement of the effects of a carbohydrate-containing food on blood-glucose levels is called the glycemic response.
Glycemic Index
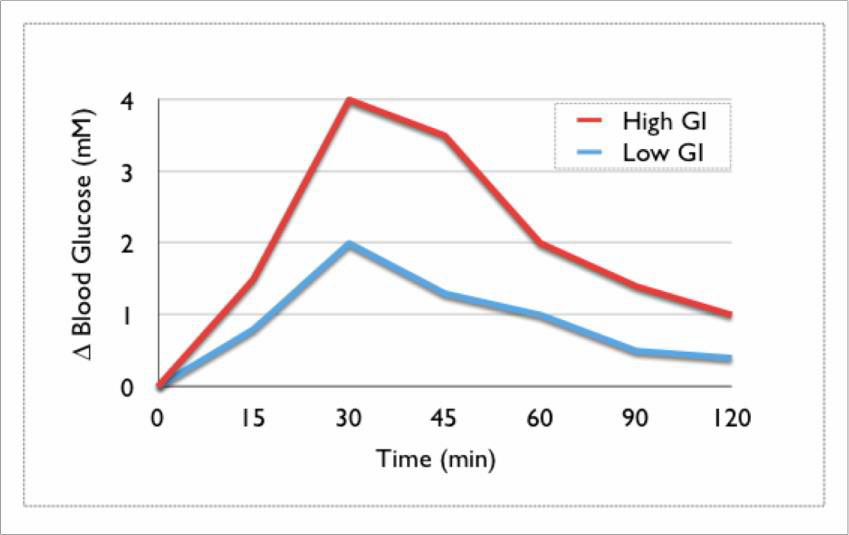
The glycemic responses of various foods have been measured and then ranked in comparison to a reference food, usually a slice of white bread or just straight glucose, to create a numeric value called the glycemic index (GI). Foods that have a low GI do not raise blood-glucose levels neither as much nor as fast as foods that have a higher GI. The graph below shows the change in blood glucose levels over time after eating a high GI food (red) vs. a low GI food (blue).
As a general guideline, a glycemic index that is 70 or greater is high, 56-69 is medium, and 55 and below is low. A diet of low-GI foods has been shown in epidemiological and clinical trial studies to increase weight loss and reduce the risk of obesity, Type 2 diabetes, and cardiovascular disease.[3]
Table 5.51 The Glycemic Index: Foods In Comparison To Glucose
| Foods | GI Value |
| Low GI Foods (< 55) | |
| Apple, raw | 36 |
| Orange, raw | 43 |
| Banana, raw | 51 |
| Mango, raw | 51 |
| Carrots, boiled | 39 |
| Taro, boiled | 53 |
| Corn tortilla | 46 |
| Spaghetti (whole wheat) | 37 |
| Baked beans | 48 |
| Soy milk | 34 |
| Skim milk | 37 |
| Whole milk | 39 |
| Yogurt, fruit | 41 |
| Yogurt, plain | 14 |
| Ice cream | 51 |
| Medium GI Foods (56–69) | |
| Pineapple, raw | 59 |
| Cantaloupe | 65 |
| Mashed potatoes | 70 |
| Whole-wheat bread | 69 |
| Brown rice | 55 |
| Cheese pizza | 60 |
| Sweet potato, boiled | 63 |
| Macaroni and cheese | 64 |
| Popcorn | 65 |
| High GI Foods (70 and higher) | |
| Banana (over-ripe) | 82 |
| Corn chips | 72 |
| Pretzels | 83 |
| White bread | 70 |
| White rice | 72 |
| Bagel | 72 |
| Rice milk | 86 |
| Cheerios | 74 |
| Raisin Bran | 73 |
| Fruit roll-up | 99 |
| Gatorade | 78 |
For the Glycemic Index on different foods, visit http://www.mendosa.com/gilists.htm.
The type of carbohydrate within a food affects the GI along with its fat and fiber content. Increased fat and fiber in foods increases the time required for digestion and delays the rate of gastric emptying into the small intestine which, ultimately reduces the GI. Processing and cooking also affects a food’s GI by increasing their digestibility. Advancements in the technologies of food processing and the high consumer demand for convenient, precooked foods in the United States has created foods that are digested and absorbed more rapidly, independent of the fiber content. Modern breakfast cereals, breads, pastas, and many prepared foods have a high GI. In contrast, most raw foods have a lower GI. (However, the more ripened a fruit or vegetable is, the higher its GI.)
The GI can be used as a guide for choosing healthier carbohydrate choices but has some limitations. The first is GI does not take into account the amount of carbohydrates in a portion of food, only the type of carbohydrate. Another is that combining low- and high-GI foods changes the GI for the meal. Also, some nutrient-dense foods have higher GIs than less nutritious food. (For instance, oatmeal has a higher GI than chocolate because the fat content of chocolate is higher.) Lastly, meats and fats do not have a GI since they do not contain carbohydrates.
The main problem with the glycemic index is that it does not take into account serving sizes. Let’s take popcorn (glycemic index 89-127) as an example. A “serving size” of popcorn is 20 g, 11 g of which is carbohydrate. This is equal to approximately 2.5 cups of popcorn. Thus, a person would have to consume over 11 cups of popcorn to consume 50 g of carbohydrate needed for the glycemic index measurement. Another example is watermelon, which has a glycemic index of 103, with a 120 g serving containing only 6 g of carbohydrates. To consume the 50 g needed for glycemic index measurement, a person would need to consume over 1000 g (1 kg or 2.2 lbs.) of watermelon. Assuming this is all watermelon flesh (no rind), this would be over 6.5 cups of watermelon.[4]
The website glycemicindex.com contains a database you can search to see the glycemic index and glycemic load (covered in the next section) of various foods. The database also contains detail on how the measurement was done, and more information on the product itself. The top link below will take you to this website. The second link is to another database that lists foods by category and also by low, medium, or high glycemic index.
Glycemic Load
To incorporate serving size into the calculation, another measure known as the glycemic load
has been developed. It is calculated as shown below:
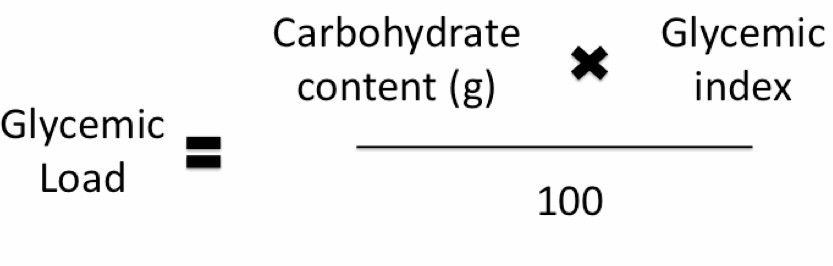
Thus, for most people, the glycemic load is a more meaningful measure of the glycemic impact of different foods. Considering the two previous examples from the glycemic index section, their glycemic loads would be:
Popcorn:
Glycemic load = (89-127 X 11 g)/100 = 9.79-13.97
Watermelon:
Glycemic load = (103 X 6 g)/100 = 6.18
As a general guideline for glycemic loads of foods: 20 or above is high, 11-19 is medium, and 10 or below is low.
Putting it all together, popcorn and watermelon have high glycemic indexes, but medium and low glycemic loads, respectively.
The glycemic index links above can also be used to find the glycemic loads of foods. The link below takes you to a NutritionData estimated glycemic load tool that is pretty good at estimating the glycemic loads of foods, even if actual glycemic indexes have not been measured.
- https://my.clevelandclinic.org/health/diseases/9815-hyperglycemia-high-blood-sugar ↵
- https://www.mayoclinic.org/diseases-conditions/hypoglycemia/symptoms-causes/syc-20373685 ↵
- Brand-Miller J, et al. Dietary Glycemic Index: Health Implications. J Am Coll Nutr. 2009; 28(4), 446S–49S. https://doi.org/10.1080/07315724.2009.10718110. Accessed September 27, 2017. ↵
- Numbers taken from: Foster-Powell K, Holt SHA, Brand-Miller J. (2002) International table of glycemic index and glycemic load values: 2002. Am J Clin Nutr 76(1): 5. and the USDA National Nutrient Database ↵
Organs are a group of tissues arranged in a specific manner to support a common physiological function.
The CDC defines epidemiological studies as scientific investigations that define frequency, distribution, and patterns of health events in a population. These studies describe the occurrence and patterns of health events over time.
Food processing involves transforming raw ingredients into packaged food, from fresh-baked goods to frozen dinners.
