
Chapter 12: Micronutrients in Bones, Blood, and Eyes
12.4 Fluoride
University of Hawai‘i at Mānoa Food Science and Human Nutrition Program
Fluoride’s Functional Role
Fluoride is known mostly as the mineral that combats tooth decay. It assists in tooth and bone development and maintenance. Fluoride combats tooth decay via three mechanisms:
- Blocking acid formation by bacteria
- Preventing demineralization of teeth
- Enhancing remineralization of destroyed enamel
Fluoride was first added to drinking water in 1945 in Grand Rapids, Michigan; now over 60 percent of the US population consumes fluoridated drinking water. The Centers for Disease Control and Prevention (CDC) has reported that fluoridation of water prevents, on average, 27 percent of cavities in children and between 20 and 40 percent of cavities in adults. The CDC considers water fluoridation one of the ten great public health achievements in the twentieth century[1].
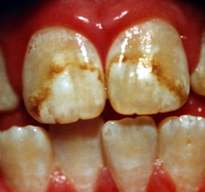
The optimal fluoride concentration in water to prevent tooth decay ranges between 0.7–1.2 milligrams per liter. Exposure to fluoride at three to five times this concentration before the growth of permanent teeth can cause fluorosis, which is the mottling and discoloring of the teeth.
Fluoride’s benefits to mineralized tissues of the teeth are well substantiated, but the effects of fluoride on bone are not as well known. Fluoride is currently being researched as a potential treatment for osteoporosis. The data are inconsistent on whether consuming fluoridated water reduces the incidence of osteoporosis and fracture risk. Fluoride does stimulate osteoblast bone building activity, and fluoride therapy in patients with osteoporosis has been shown to increase bone mineral density (BMD). In general, it appears that at low doses, fluoride treatment increases BMD in people with osteoporosis and is more effective in increasing bone quality when the intakes of calcium and vitamin D are adequate. The Food and Drug Administration has not approved fluoride for the treatment of osteoporosis mainly because its benefits are not sufficiently known and it has several side effects including frequent stomach upset and joint pain. The doses of fluoride used to treat osteoporosis are much greater than that in fluoridated water.
Dietary Reference Intake
The IOM has given Adequate Intakes (AI) for fluoride, but has not yet developed RDAs. The AIs are based on the doses of fluoride shown to reduce the incidence of cavities, but not cause dental fluorosis. From infancy to adolescence, the AIs for fluoride increase from 0.01 milligrams per day for ages less than six months to 2 milligrams per day for those between the ages of fourteen and eighteen. In adulthood, the AI for males is 4 milligrams per day and for females is 3 milligrams per day. The UL for young children is set at 1.3 and 2.2 milligrams per day for girls and boys, respectively. For adults, the UL is set at 10 milligrams per day.
Table 12.41 Dietary Reference Intakes for Fluoride[2]
| Age Group | AI (mg/day) | UL (mg/day) |
| Infants (0–6 months) | 0.01 | 0.7 |
| Infants (7–12 months) | 0.5 | 0.9 |
| Children (1–3 years) | 0.7 | 1.3 |
| Children (4–8 years) | 1 | 2.2 |
| Children (9–13 years) | 2 | 10.0 |
| Adolescents (14–18 years) | 3 | 10.0 |
| Adult (> 19 years) | 4 (males), 3 (females) | 10.0 |
| Pregnancy & Lactation | 3 | 10.0 |
Dietary Sources of Fluoride
Table 12.42 Fluoride Content of Various Foods[3]
| Food | Serving | Fluoride (mg) | Percent Daily Value* |
| Fruit Juice | 3.5 fl oz. | 0.02-2.1 | 0.7-70 |
| Crab, canned | 3.5 oz. | 0.21 | 7 |
| Rice, cooked | 3.5 oz. | 0.04 | 1.3 |
| Fish, cooked | 3.5 oz. | 0.02 | 0.7 |
| Chicken | 3.5 oz. | 0.015 | 0.5 |
| * Current AI used to determine Percent Daily Value |
- 10 Great Public Health Achievements in the 20th Century. Centers for Disease Control, Morbidity and Mortality Weekly Report. 1999; 48(12), 241–43. https://www.cdc.gov/mmwr/preview/mmwrhtml/00056796.htm. Accessed November 22, 2017. ↵
- Dietary Fact Sheet for Health Professionals: Fluoride. National Institute of Health, Office of Dietary Supplements. https://ods.od.nih.gov/factsheets/Fluoride-HealthProfessional/. Updated April 26, 2022. Accessed August 3, 2023. ↵
- Micronutrient Information Center: Fluoride. Oregon State University, Linus Pauling Institute. lpi.oregonstate.edu/mic/minerals/fluoride . Updated in April 29, 2015. Accessed October 22, 2017. ↵
The Centers for Disease Control and Prevention (CDC) are the government agency tasked with monitoring illness in the United States. They gather data from public health departments in all 50 states and monitor the data to detect new outbreaks of disease, monitor existing health concerns, and track the success of public health initiatives. The CDC also carries out research and trains public health experts who can be dispatched to control outbreaks of disease. Much of the CDC’s work is focused on infectious disease, but they also track cases of foodborne illness.https://www.cdc.gov/
A bone mineral density (BMD) test measures how much calcium and other types of minerals are in an area of your bone.
https://medlineplus.gov/ency/article/007197.htm
Adequate Intake are created for nutrients when there is insufficient consistent scientific evidence to set an EAR for the entire population.
Infancy is the earliest part of childhood. It is the period from birth through age one.
